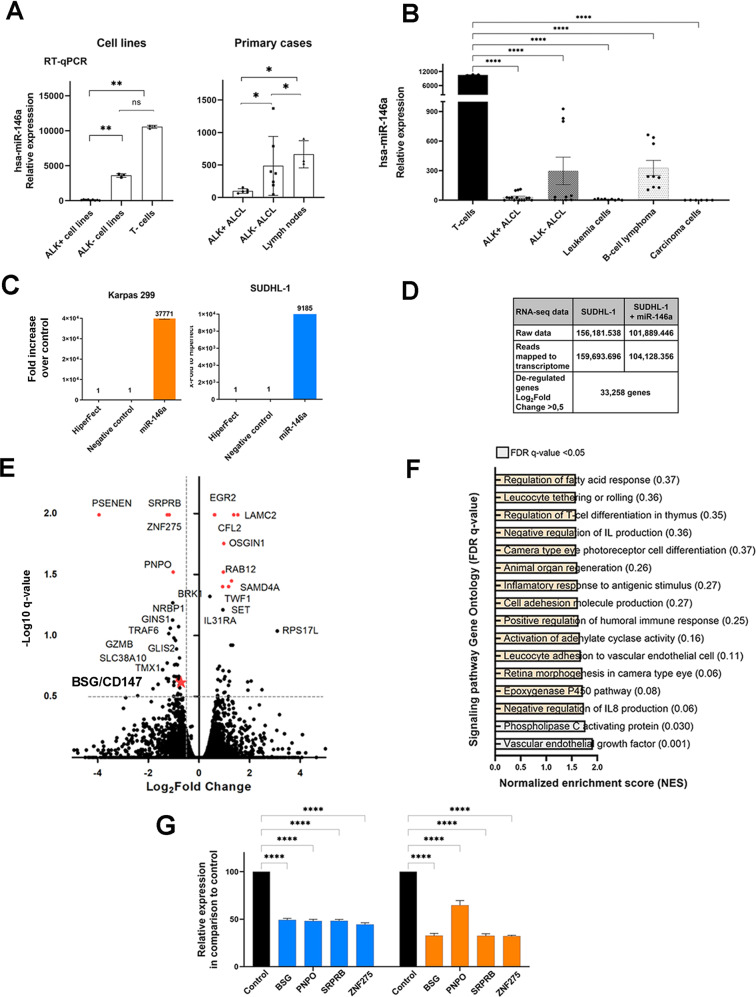
Fig. 1. miR-146a target genes.
A RT-qPCR results of miR-146a expression in primary ALK+ ALCL cases (ALK+ five cases, ALK− seven cases and four reactive lymph nodes) and cell lines. For cell line analysis ALK+ ALCL cell lines (SUDHL-1, KiJK, Karpas 299) were compared to the ALK− ALCL cell line (Mac-1) and CD3+ T cells from 3 healthy donors. Every point represents the average of three independent measurements. For RT qPCR quantifications values were normalized to miR-106b and analyzed using the 2−ΔΔCp method [6]. B Comparison of miR146a expression levels in ALK+ ALCL cells (SUDHL-1, Karpas 299, KiJK, SR786, SUP-M2), ALK− ALCL cells (FE-PD, Mac-1 and Mac2a), CD3+ T cells from 3 healthy donors, leukemia cells (Jurkat and HL-60), B-cell lymphoma cells (SUDHL-4, jeko-1 Rec-1 and and KMS-12) and carcinoma cell lines (HeLa, HEK293-T). Every point represents the average from three independent measurements. For RT qPCR quantifications values were normalized to miR-106b and analyzed using the 2−ΔΔCp method. C RT-qPCR results of relative miR-146a expression levels in untransfected, and miR-146a mimic-transfected SUDHL-1 (blue) and Karpas 299 (orange) cells. For RT-qPCR quantification, values were normalized to miR-106b, and data were analyzed according to the 2−ΔΔCp method. Results are depicted as miRNA levels relative to mean value levels of HiperFect treated cells. D Overview of the reads generated in the transcriptome analysis by NGS, and number of deregulated genes comparing control/ miR-146a overexpression. E Volcano plot of RNA-seq transcriptome data displaying the differentially expressed genes (FDR-corrected p ≤ 0.05). Significantly regulated genes after miR-146a overexpression (>0.5 Log2 Fold change) are depicted with orange dots (four downregulated genes left side). Coordinates of CD147 is marked with an orange star. F Bar graphs represent Gene Ontology pathways enriched in the Gene Set Enrichment Analysis (GSEA) of the differentially expressed genes ranking list. Signaling pathway with FDR q-value <0.05 are highlighted in gray. G RT-qPCR analysis of miR-146a regulated target genes. Relative expression levels of the four selected candidate genes (ZNF275, SRPRB, PNPO and CD147) regulated by miR-146a were determined by RT-qPCR analysis in miR-146a transfected or untransfected SUDHL-1 (blue) and Karpas 299 (orange) cells. Relative mRNA downregulation of the candidate genes was identified using RT-qPCR quantification to ACTB and data were analyzed according to the 2−ΔΔCp method. Each plot represents the average from biological triplicates. For statistical analysis unpaired t-test (target vs control) was performed. Results are depicted as mRNA levels relative to mean value levels of HiperFect treated SUDHL-1 and Karpas 299 cells (control).

