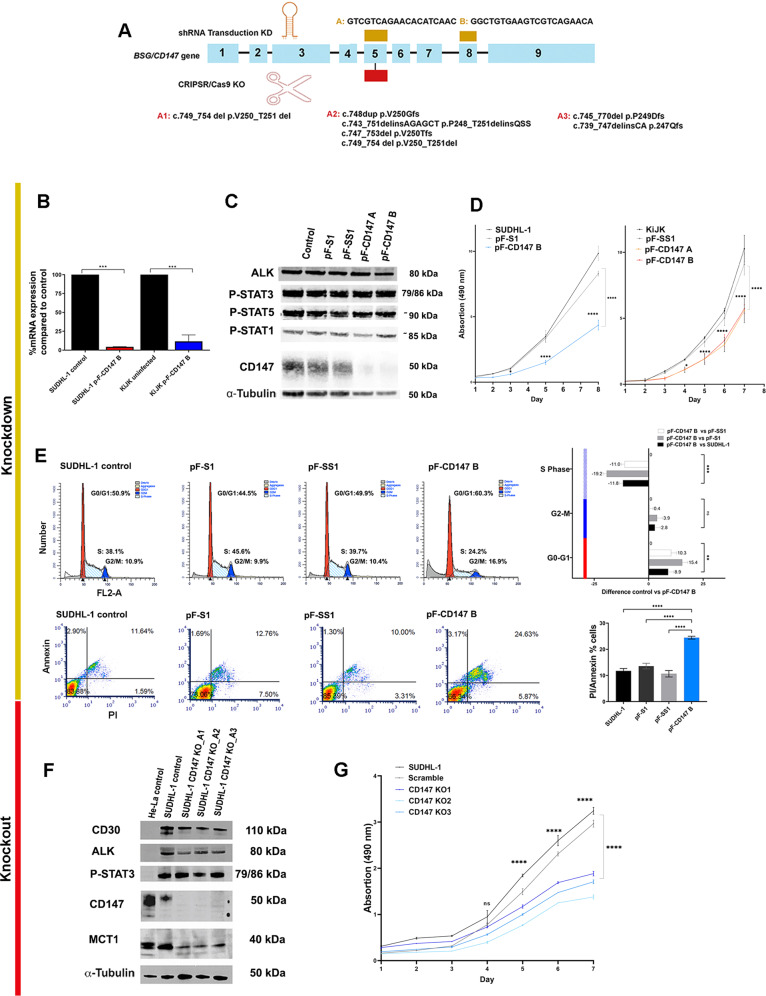
Fig. 3. CD147 contributes to the survival and proliferation of ALK+ ALCL cells in vitro.
A Overview of CD147 silencing using shRNA transduction and CRISPR/Cas 9 editing system. The upper diagram depicts the shRNAs harpins and their target regions (gold rectangles) within the CD147 gene, whereas the lower diagram illustrates the target exon of CD147 and the mutations after CRIPSR/Cas9 editing (red rectangle). B RT-qPCR analysis of CD147 mRNA in the transduced SUDHL-1 and KiJK cells three days after second infection. Values were normalized to ACTB and data were analyzed according to the 2−ΔΔCp method. Results are depicted as mRNA amount relative to untreated SUDHL-1 cells. Error bars indicate standard deviation (SD, n = 3). For statistical analysis ANOVA for repetitive measurements was used (*p < 0.05, **p < 0.01 vs. control group). C Western blot analysis of CD147, ALK and p-STAT3, p-STAT5 and p-STAT1 in SUDHL-1 cells transduced with CD147 shRNA four days after infection. Blots were performed by triplicates; one representative replicate is depicted. Thirty µg protein were loaded and α-Tubulin was used as loading control. D Proliferation curves of the controls and CD147-shRNA infected SUDHL-1 and KiJK cells are depicted up to 8 days after infection. Error bars indicate error of the mean (SEM), (n = 3). Statistical analysis was performed using unpaired t-test (for only two group comparison) and repeated measures ANOVA (pFCD147 vs pF, pF-S, and pFSS1) significant differences at different time points and ending point are indicated as **p < 0.001 ****p < 0.0001. Control = uninfected cells, pF -scrambled = virus containing non-targeted shRNA sequence, pF-CD147 B = virus containing the CD147 shRNA sequence, CD147-KD B. E Cell cycle distribution of the SUDHL-1 controls and CD147-KD cells four days after infection (pF.CD147B vs uninfected, pF-S, and pFSS1). The differences of cell cycle distribution between controls and CD147-KD cells are depicted in graph plots, every plot represents the median and standard deviation (SD). Percentage of annexin/PI staining cells of controls and infected cells are also depicted. Every plot represents the median and SD of the percentage of staining cells of the biological triplicates. Statistical analysis was performed using unpaired t-test. Ns = non-significant, *p < 0,05, **p < 0.01, ***p < 0.001. F Western blot analysis of MCT1, CD147, P-STAT3, ALK and CD30 in SUDHL-1 after CRISPR/Cas9 editing. Sixty µg of protein were loaded and α-Tubulin was used as loading control. Lysates of HeLa and SUDHL-1 untreated cells served as controls. G Proliferation curves of the controls and CD147-KO SUDHL-1 cells are depicted. Error bars indicate SEM (n = 3). Statistical analysis was performed using unpaired t-test (for only two group comparison) and repeated measures ANOVA (CD147 KO1-3 vs control) significant differences at different time points and ending point are indicated as *p < 0.05, **p < 0.005, ***p < 0.0005. SUDHL-1 control = uninfected cells, KO 1-2 and 3: three different knockout (KO) clones with different mutations.

