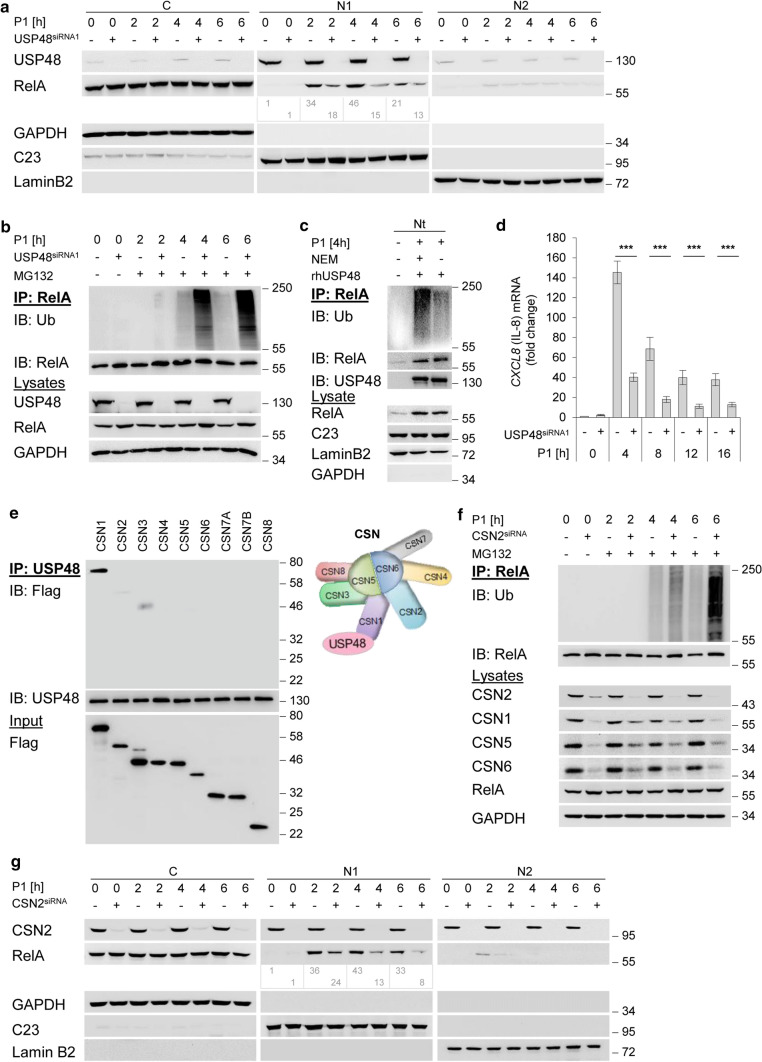
Fig. 2.
CSN-associated USP48 deubiquitinylates nuclear RelA. a AGS cells were transfected with siRNA against USP48 and infected with H. pylori for indicated times. Subcellular fractions were subjected to IB analysis of the indicated proteins. b AGS cells were transfected with siRNA against USP48 and infected with H. pylori for the indicated times (MG132 was added 30 min after infection). IP with an anti-RelA antibody or isotype-matched antibody (IgG) was performed at the indicated times in the presence of NEM and OPT, followed by IB analysis of the indicated proteins. c RelA-IP from the total nuclear fraction of H. pylori-infected AGS cells was incubated with recombinant human USP48 in the presence or absence of NEM, followed by IB analysis of the indicated proteins. d AGS cells were transfected with siRNA against USP48 and infected with H. pylori for the indicated times. Total RNA was isolated at the indicated times and analysed using quantitative RT-PCR for the CXCL8 transcript (the gene of IL-8). Data shown depict the average of triplicate determinations normalized to GAPDH housekeeping gene. Error bars denote mean ± SD. e Equimolar amounts of in-vitro translated Flag-CSN subunits and 0.5 μg of recombinant human USP48 were incubated at 37 °C for 1 h. IP with an anti-USP48 antibody was performed, followed by IB analysis with anti-Flag and anti-USP48 antibodies. f AGS cells were transfected with siRNA against CSN2 and infected with H. pylori for the indicated times (MG132 was added 30 min after infection). IP with an anti-RelA antibody was performed at the indicated times in the presence of NEM and OPT, followed by IB analysis of the indicated proteins. g AGS cells were transfected with siRNA against CSN2 and infected with H. pylori for indicated times. Subcellular fractions were subjected to IB analysis of the indicated proteins. Data information: Data shown in (a–c, e–g) are representative for at least two independent experiments. Data shown in (d) are from three independent experiments with three technical replicates. ***P ≤ 0.001 (Student’s t-test). The band intensities shown in (a, g) were quantified using ImageJ software (NIH). GAPDH, C23 and LaminB2 served as load controls and indicate the purity of the subcellular fractions

