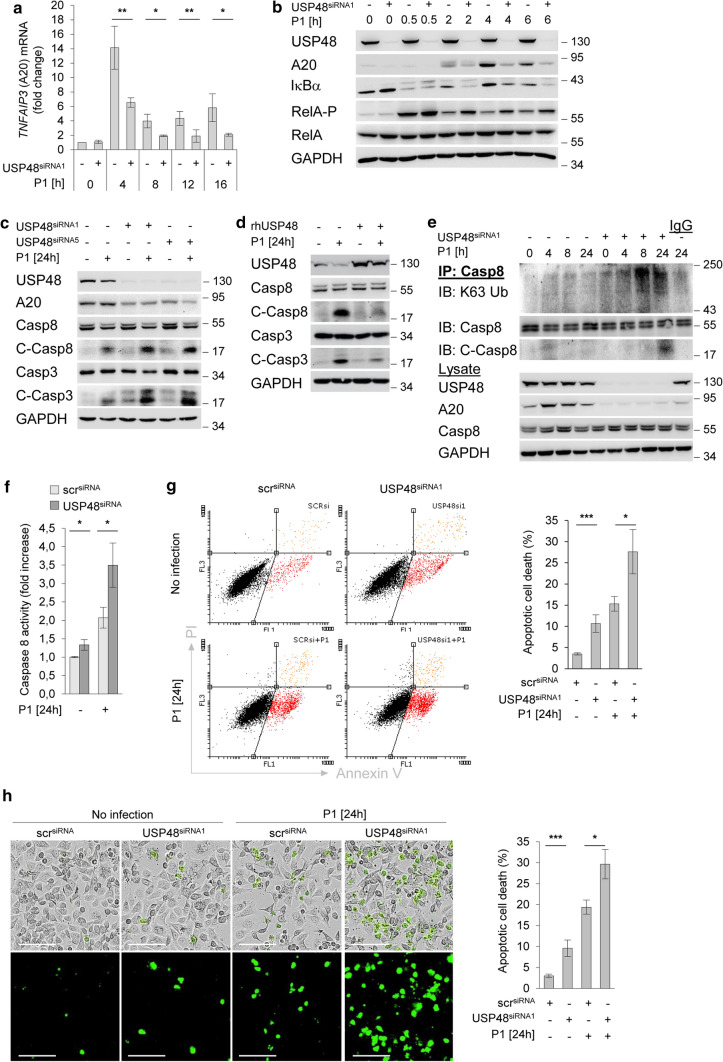
Fig. 3.
USP48 controls A20 de novo synthesis and suppresses caspase cleavages. a AGS cells were transfected with siRNA against USP48 and infected with H. pylori for the indicated times. Total RNA was isolated at the indicated times and analysed using quantitative RT-PCR for the TNFAIP3 transcript (gene of A20). Data shown depict the average of triplicate determinations normalized to GAPDH housekeeping gene. Error bars denote mean ± SD. b, c AGS cells were transfected with siRNA against USP48 and infected with H. pylori for indicated times. Whole-cell lysates were subjected to IB for analysis of the indicated proteins. C-Casp8 or C-Casp3 = cleaved caspases. d AGS cells were transfected with recombinant human USP48 and infected with H. pylori for 24 h. Whole-cell lysates were subjected to IB analysis of the indicated proteins. e AGS cells were transfected with siRNA against USP48 and infected with H. pylori for the indicated times. IP with an anti-Caspase-8 antibody was performed at the indicated times in the presence of NEM and OPT, followed by IB analysis of the indicated proteins. f AGS cells transfected with siRNA were infected with H. pylori for 24 h before incubation with Caspase-Glo® 8 reagent for 1 h. Luminescence of caspase-8 activity was measured and calculated as a fold increase compared to the uninfected scramble control. g AGS cells were transfected with siRNA against USP48 and infected with H. pylori for 24 h, followed by staining with annexin V/PI. Apoptotic cell death was analysed by flow cytometry. Data shown depict the average of two independent experiments. Error bars denote mean ± SD. h AGS cells were transfected with siRNA against USP48 and infected with H. pylori for 24 h. Cleaved caspase-3/7 expression was detected by the IncuCyte® S3 Live-Cell Analysis Image system. Scale bars = 100 µm. Data shown depict the average of four pictures from distinct regions. Error bars denote mean ± SD. Data information: Data shown in (a) are from three independent experiments with three technical replicates. Data shown in (b–e, g) are representative for at least two independent experiments. Data shown in (f) are from one experiment with three technical replicates. Data shown in (h) are from one experiments with four technical replicates. *P ≤ 0.05, **P ≤ 0.01, ***P ≤ 0.001 (Student’s t-test)

