
FIGURE 1.
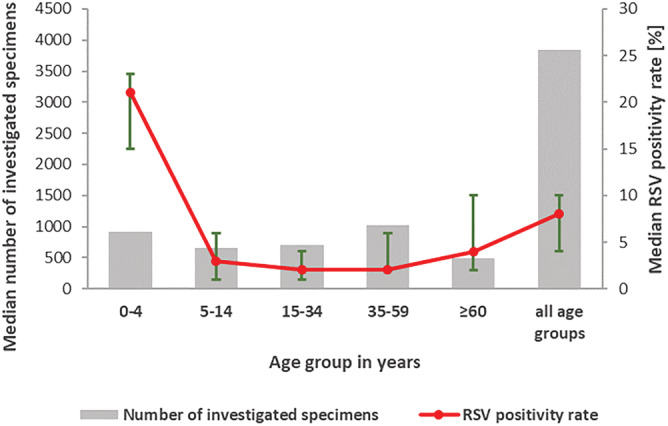
Median number of investigated specimens (gray bars) and median RSV positivity rate (red line) with range (green error indicators) in different age groups, calendar weeks 40 to 20 in seasons 2011/12 to 2019/20
Official websites use .gov
A
.gov website belongs to an official
government organization in the United States.
Secure .gov websites use HTTPS
A lock (
) or https:// means you've safely
connected to the .gov website. Share sensitive
information only on official, secure websites.
Median number of investigated specimens (gray bars) and median RSV positivity rate (red line) with range (green error indicators) in different age groups, calendar weeks 40 to 20 in seasons 2011/12 to 2019/20