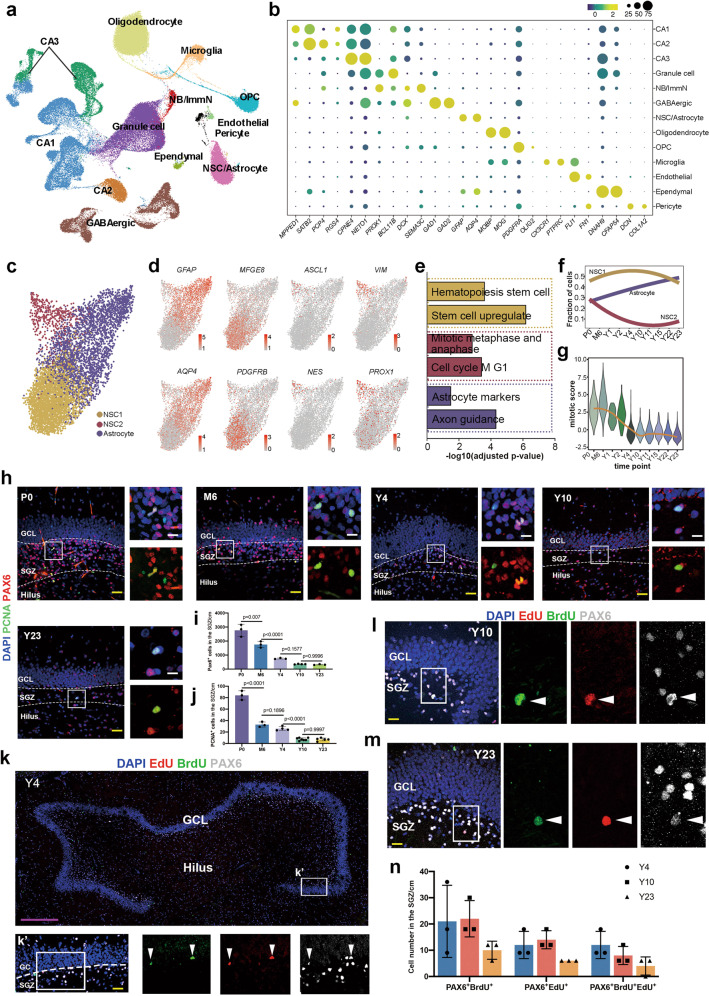
Fig. 1. Transcriptional profiles of the macaque hippocampi at single-nucleus resolution.
a Clustering of individual hippocampal cells from macaques of different ages via UMAP. Cells are colored by cluster annotation. b Dot plot showing the average expression of marker genes for the 13 main cell types in a. CA cornu ammonis, ImmN immature neuron, NSC/Astrocyte Neural stem cell/Astrocyte, OPC oligodendrocyte progenitor. c Visualization of NSC/Astrocyte subclusters using UMAP. d The expression of DEGs among the three distinct NSC/Astrocyte subclusters was projected onto UMAP. Cells are colored according to the gene expression levels (red, high; gray, low). e Bar plot of enriched GO terms in NSC/Astrocyte subclusters. f Fitted curves show the fraction of cells from three NSC/Astrocyte subclusters at different time points. g Mitotic score analysis shows that the proliferation capacity of NSCs in the SGZ of the hippocampi of macaques declined with age. h–j The number of NSCs and proliferating NSCs declined with age, as revealed by the NSC marker PAX6 and the proliferating cell marker PCNA. Sidak’s multiple comparisons test was used, and each dot represents a single experiment. Data are shown as means ± SD. Scale bar in yellow, 50 µm; scale bar in white, 20 µm. k–m Adult NSCs in the DG of the hippocampus undergo consecutive proliferation in macaques, as evidenced by EdU/BrdU/PAX6 triple staining. The arrowheads indicate EdU/BrdU/Pax6 triple-positive cells. Scale bar in magenta, 500 µm; scale bar in yellow, 50 µm. n Quantification of staining for the neural stem cell marker PAX6 with EdU and BrdU. Sidak’s multiple comparisons test was used, and each dot represents a single experiment. Data are shown as means ± SD. See also Supplementary information, Figs. S1 and S2.

