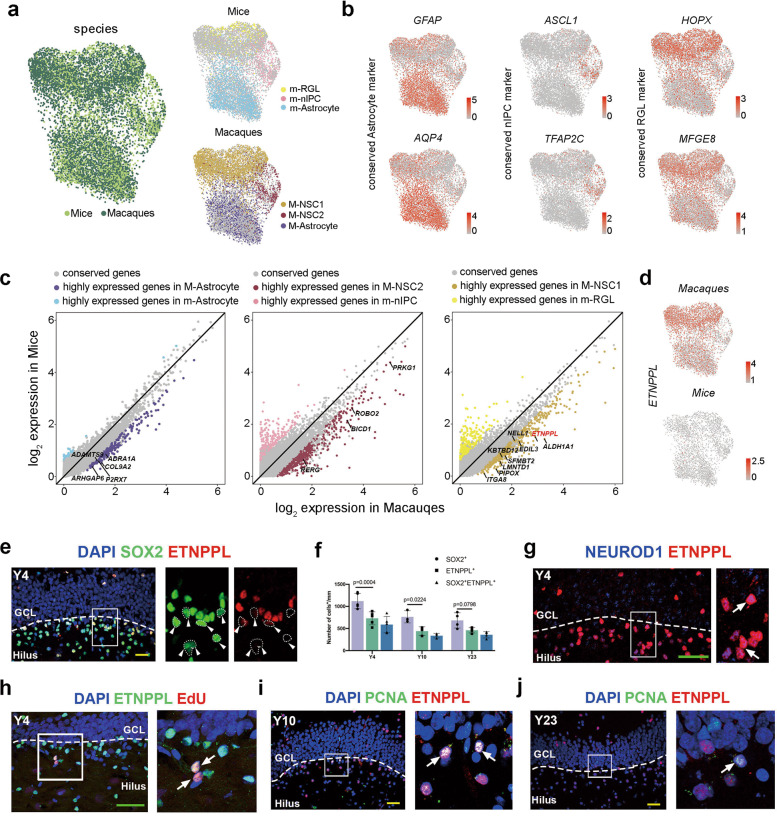
Fig. 2. ETNPPL is identified as a primate-specific NSC marker.
a UMAP showing the integration of macaques and mouse cells (left). UMAP showing the distribution of mouse cells (right-upper panel) and macaque cells (right-lower panel) in the integrated dataset. b The expression of conserved genes in mice and macaques among the three distinct NSC/Astrocyte subclusters. Cells are colored according to the gene expression levels (red, high; gray, low). c Scatter plot showing species-enriched genes in mice and macaques among the three distinct NSC/Astrocyte subclusters. d Featureplot showing ETNPPL expression in macaques (upper panel) but not in mice (lower panel). e, f Colocalization analysis of SOX2 and ETNPPL showed that most ETNPPL+ cells coexpressed SOX2, and the arrowheads indicate SOX2+ETNPPL− cells. g A portion of ETNPPL-expressing cells coexpressing the committed neurogenic progenitor marker NEUROD1; the arrows indicate ETNPPL/NEUROD1 double-positive cells. h Immunostaining showing ETNPPL colocalization with EdU in 4-year-old brain tissue. The arrows indicate ETNPPL/EdU double-positive cells. ETNPPL+ PCNA+ cells in the SGZ of the hippocampi of 10-year-old (i) and 23-year-old (j) macaques. Scale bar in green, 80 µm; scale bar in yellow, 50 µm. The arrows indicate ETNPPL/PCNA double-positive cells. See also Supplementary information, Fig. S3.

