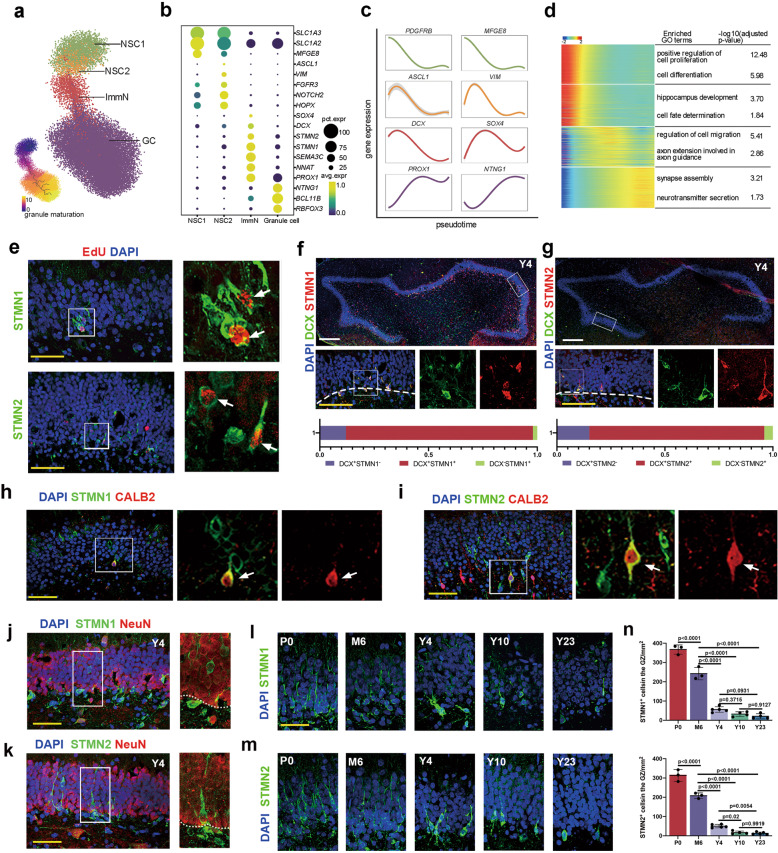
Fig. 3. Hippocampal neurogenesis analysis across the lifespan of macaques.
a The developmental trajectory of the neurogenic lineage is visualized using UMAP. The pseudotime analysis of individual cells is also shown (bottom left panel). b Dot plot showing the average expression of DEGs among different cell types in a. c Fitted curve showing the expression of representative genes over pseudotime. d Heatmap illustrating the expression of genes that covary across pseudotime. The enriched GO terms are also shown. e The colocalization of STMN1 and STMN2 with EdU indicates that these cells are generated via mitosis. The arrows indicate STMN1/EdU- or STMN2/EdU-positive cells. Scale bar in white, 500 µm; scale bar in yellow, 50 µm. f, g Immunostaining analysis showing STMN1/DCX (86%) and STMN2/DCX (81%) double-positive cells. h–k Colocalization analysis of STMN1 (h) and STMN2 (i) with CALB2; the arrows indicate colocalization. Colocalization analysis of STMN1 (j) and STMN2 (k) with NeuN. i–n Time-course analysis and quantification of STMN1 and STMN2 expression in the DG of the hippocampus indicating decreased but persistent neurogenesis in the aged brains. Sidak’s multiple comparisons test was used, and each dot represents a single experiment. Data are shown as means ± SD. Scale bar in white, 500 µm; scale bar in yellow, 50 µm. See also Supplementary information, Figs. S4–S6.

