Figure 3.
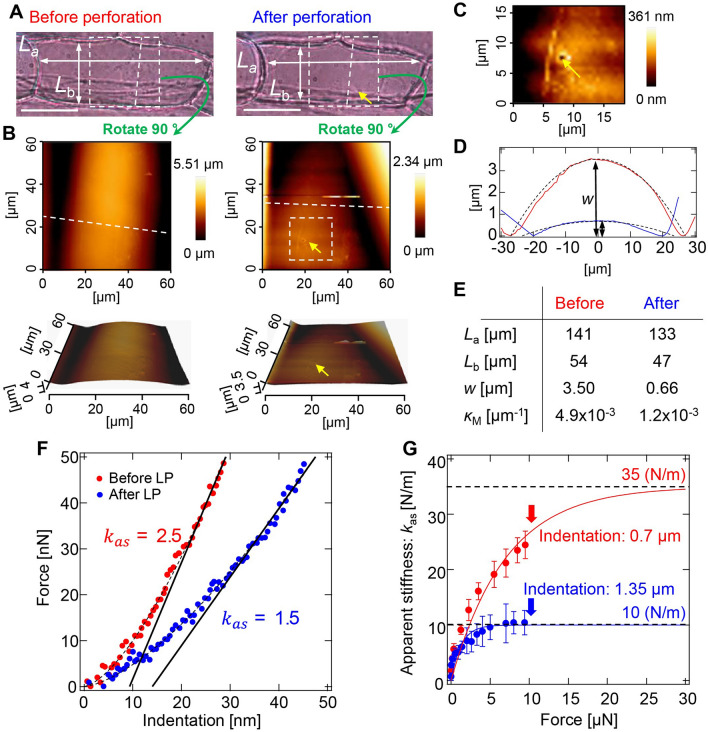
AFM measurement of an onion epidermal cell with laser perforation. (A) Photographs of the cell measured before (left) and after (right) perforation. Yellow arrow indicates the perforation point. Cell lengths along long- and short- axes are denoted by La and Lb, respectively. Bars, 50 µm. (B) Topographic images before (left) and after (right) perforation. Measurement area corresponds to the dashed box area in (A). Lower images are three-dimensional images of upper images. (C) Enlarged image of the perforation point. (D) Cross-sectional graph of the cell wall surface before (red line) and after (blue line) perforation, corresponding to the height of dashed lines in upper-left and -right images in (B), respectively. Bulge height of the cell surface is denoted by w. Dashed lines are curves for curvature calculated from Lb and w. (E) Quantities determined from AFM measurement. Mean curvature of the cell wall surface κM is calculated from La, Lb, and w. (F) Force–indentation curves of the cell wall before (red dots) and after (blue dots) perforation. Dashed lines are fitting curves by the Hertz model and solid lines are fitting lines by the shell model. (G) Apparent stiffness kas as a function of force F applied to the cell wall before (red dots) and after (blue dots) perforation. kas is estimated by linear least squares fitting of the force-indentation curve in the vicinity of the F, as shown in (F). Bars on dots represent root mean squared error. Solid lines are exponential plateau curves: kas = 35 × {1 − exp(− F/7)} (red line); kas = 10 × {1 − exp(− F/1.28)} (blue line).

