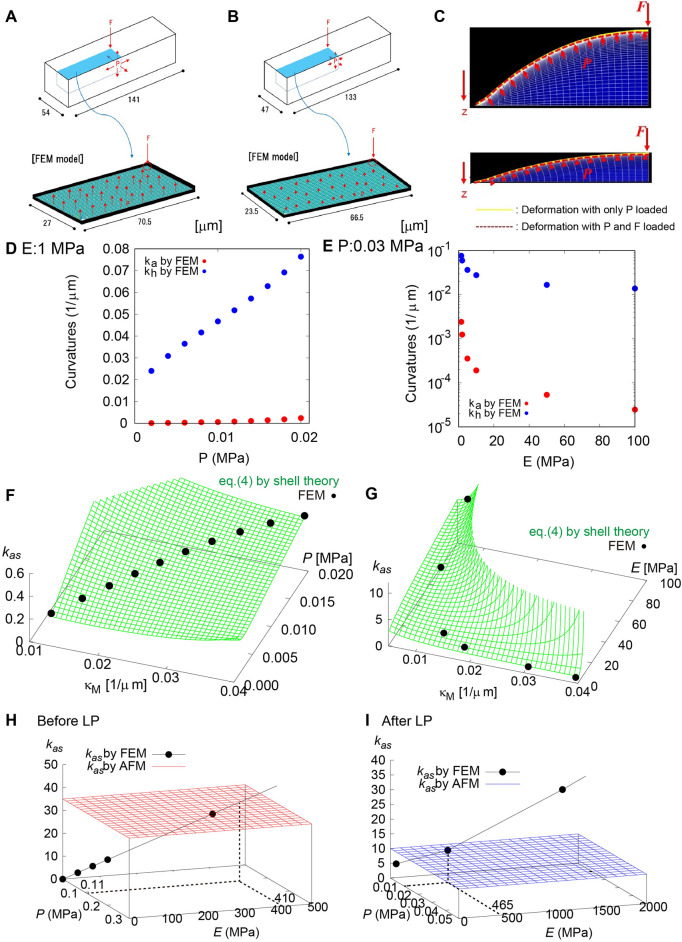
Figure 5.
Verification of our theoretical results based on FEM simulation. (A, B) FEM model based on the actual cell surface geometry before (A) and after (B) LP. (C) Cell surface deformation before (top) and after (bottom) LP. Yellow and red lines are deformations with P and with P and F, respectively. (D, E) Axial curvature κa and hoop curvature κh calculated as a function of turgor pressure P when E = 1.0 MPa (D) and as a function of Young’s modulus E when P = 0.03 MPa (E). (F, G) Apparent stiffness kas before LP calculated as a function of κM and P when E = 1.0 MPa (F) and as a function of mean curvature κM and E when P = 0.03 MPa (G). Black dots calculated by the FEM simulation are on green surfaces calculated using Eq. (4). (H, I) Estimation of E and P using kas measured before (H) and after (I) LP. Black dots calculated by the FEM simulation are interpolated using Eq. (4) (black line). Dots on the red and blue planes in (H) and (I) indicate E and P, respectively, in agreement with kas quantified using the AFM measurement.

