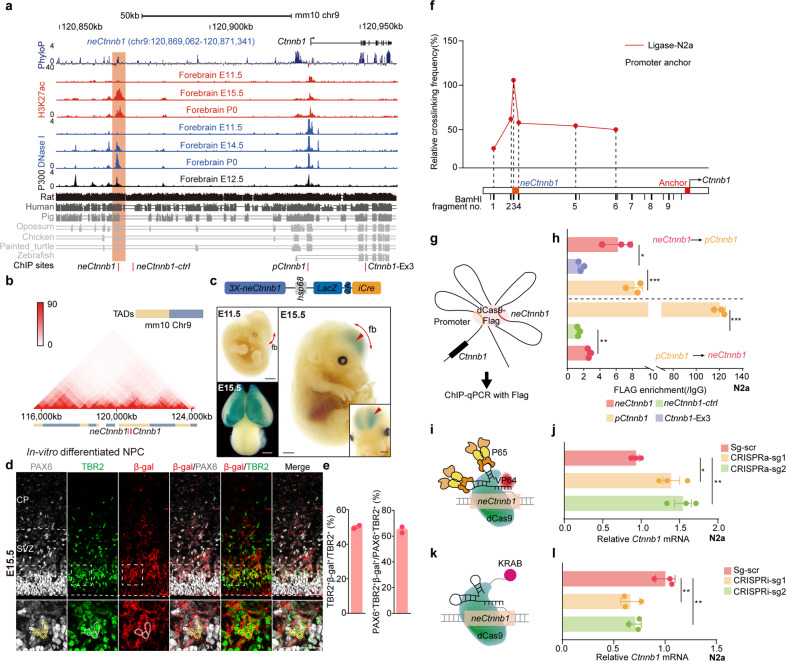
Fig. 1. neCtnnb1 is a neocortex-specific enhancer of Ctnnb1.
a Schematic representation of the upstream region of mouse Ctnnb1 gene and the location of putative enhancer neCtnnb1 (2.28 kb, orange shading), which is evolutionarily conserved among amniotes and enriched with H3K27ac, DNase I hypersensitivity and P300 in developing forebrains. Data were obtained from ENCODE. Locations of ChIP sites in (h) were indicated. b Hi-C data of in-vitro differentiated NPCs were obtained from the 3D genome browser. Boundaries of the TADs and locations of Ctnnb1 and neCtnnb1 (red bar) were marked below. c Top: a schematic illustration showing the transgenic construct carries three tandem neCtnnb1 sequences, the hsp68 mini-promoter, the LacZ reporter gene and inducible CreERT2 (iCre). Bottom: X-Gal staining (blue) in E11.5 and E15.5 neCtnnb1-LacZ-iCre embryos and brains. Signals at E15.5 dorsal forebrains (fb) were indicated with red arrows and enlarged. d Immunofluorescence of PAX6 (gray), TBR2 (green), and β-Gal (red) on coronal sections of E15.5 neCtnnb1-LacZ-iCre Ncx. e Bar plots showing TBR2 + β-gal+ cells relative of TBR2 + cells (left) and PAX6 + TBR2 + β-gal+ cells relative of PAX6 + TBR2 + cells (right) in E15.5 neCtnnb1-LacZ-iCre Ncx. n = 2 for neCtnnb1-LacZ-iCre brains. Each point represents an individual brain. f The 3C assay performed using Neuro-2a neuroblastoma cells. The Ctnnb1 promoter (pCtnnb1) is the anchor point from which long-range DNA interactions across the neCtnnb1 interval were measured. Numbers over the data points represent fragment locations. g Schematics show the ChIP-qPCR evaluating the physical association between the pCtnnb1 and neCtnnb1. h ChIP-qPCR measuring enrichment of pCtnnb1 and neCtnnb1 after Flag-tagged dCas9 were targeted to neCtnnb1 and pCtnnb1 respectively. Each point represents an independent experiment. I, k Schematics showing the CRISPR activation (CRISPRa, i) and CRISPR interference (CRISPRi, k) experiments. j, l RNA levels of Ctnnb1 in Neuro-2a cells transfected with indicated CRISPRa (j) or CRISPRi (l) vectors for two days. In h quantification data are shown as means ± SEM, statistical significance was determined using two-way ANOVA followed by Tukey’s multiple comparisons test. In j and l, quantification data are shown as means ± SD, statistical significance was determined using one-way ANOVA analysis, *P < 0.05, **P < 0.01, and ***P < 0.001. ns, not significant. Scale bars, 1 mm (c), 50 μm (d). fb, forebrain; CP, cortical plate; VZ, ventricular zone; SVZ, subventricular zone.

