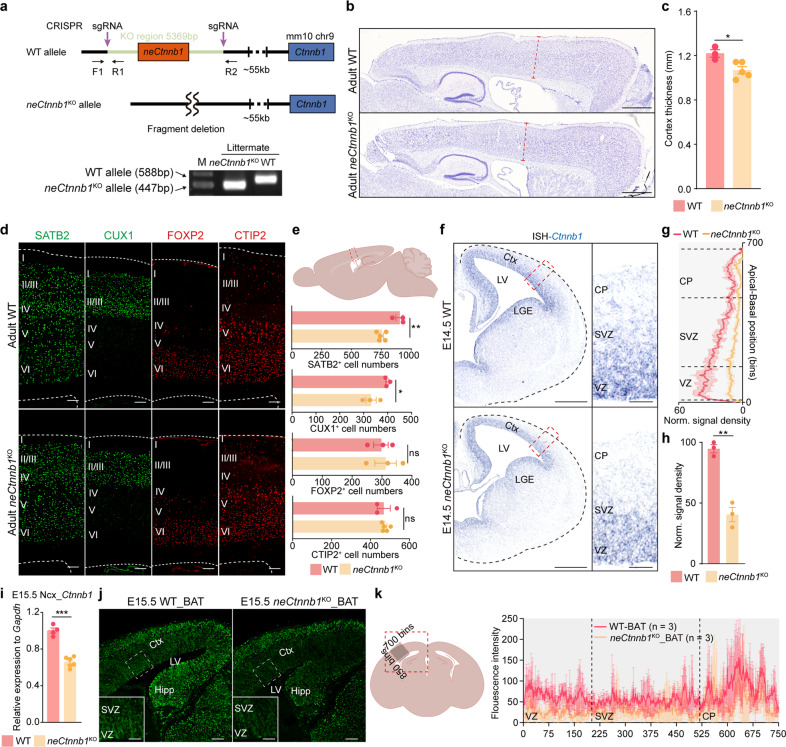
Fig. 2. Knock-out of neCtnnb1 in mice inhibits the production of upper-layer PNs and Ctnnb1 transcription.
a Generation and genotyping of neCtnnb1KO mice. WT, wild-type; gRNA, guide RNA. b Nissl-staining on adult WT and neCtnnb1KO sagittal brain sections. c Comparison of neocortical thickness of adult WT and neCtnnb1KO mice. n = 3 for WT brains and n = 5 for neCtnnb1KO brains. Each point represents an individual brain. d, e Immunofluorescence (d) and quantification (e, top) of SATB2 + , CUX1 + , FOXP2 + and CTIP2 + neurons on boxed area of sagittal sections (e) of adult WT and neCtnnb1KO Ncx. Each point represents an individual brain. f In situ hybridization (ISH) of Ctnnb1 on E14.5 WT (top) and neCtnnb1KO (bottom) coronal brain sections, with boxed regions magnified on the right. g, h Quantification of normalized ISH signal densities in boxed regions of (f). n = 3 for WT brains and n = 3 for neCtnnb1KO brains. Each point represents an individual brain. i RT-qPCR showing expressions of Ctnnb1 in E15.5 WT and neCtnnb1KO neocortex. n = 4 for WT Ncx and n = 6 for neCtnnb1KO Ncx. Each point represents an individual brain. j β-Gal immunostaining on the E15.5 coronal sections of WT_BAT (left) and neCtnnb1KO_BAT (right) Ncx. Boxed regions are enlarged at the bottom left corners. k Quantification of normalized signal density of β-Gal in boxed regions of (j). n = 3 for WT brains and n = 3 for neCtnnb1KO brains. Each point represents an individual brain. Quantification data are shown as means ± SEM. Statistical significance was determined using an unpaired two-tailed Student’s t-test (c, e, h and i). *P < 0.05, **P < 0.01, and ***P < 0.001. ns, not significant. Scale bars, 500 μm (f), 200 μm (b), 100 μm (d and j), 50 μm (magnified views in f and j). CP, cortical plate; VZ, ventricular zone; SVZ, subventricular zone; Ctx, cortex; LV, lateral ventricular; LGE, lateral ganglionic eminences; Hipp, Hippocampal primordium.

