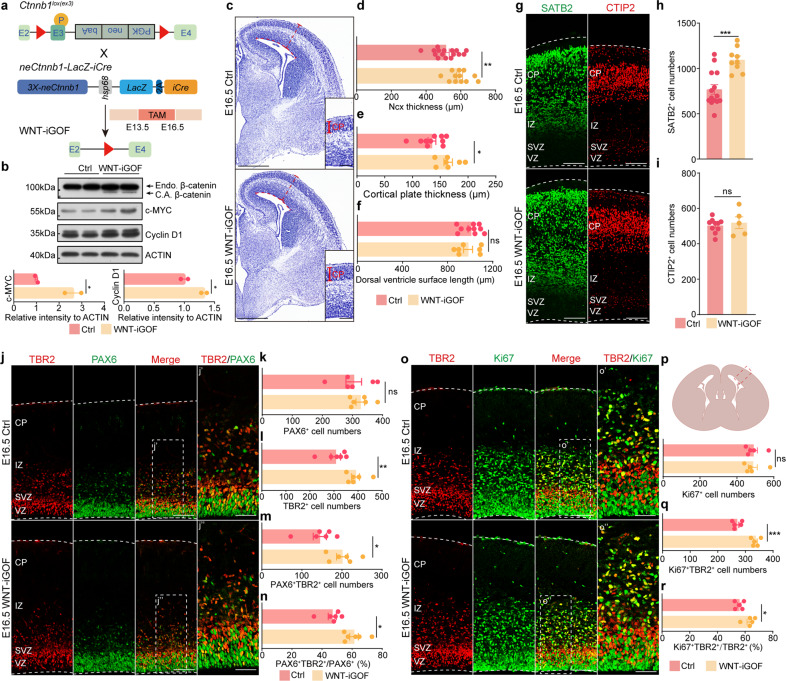
Fig. 4. Stabilization of β-catenin in neCtnnb1-active cells promotes the production and transit-amplification of IPs in developing neocortices.
a Schematics show mating of Ctnnb1lox(ex3) mice with neCtnnb1-LacZ-iCre mice. Pregnant mice were injected with tamoxifen (TAM) at E13.5 and sacrificed at E16.5. b Top: immunoblotting of β-catenin, c-MYC, Cyclin D1 and ACTIN using protein lysates of Ctrl - Ctnnb1lox(ex3) and WNT-iGOF - neCtnnb1-LacZ-iCre;Ctnnb1lox(ex3) neocortices. Bottom: histograms show protein levels of c-MYC and Cyclin D1 normalized to ACTIN levels. Values of Ctrl neocortices were set as ‘1’. C.A. β-catenin, the constitutively active (non-degradable) β-catenin caused by deletion of Ctnnb1’s exon 3; Endo. β-catenin, endogenous β-catenin. c Nissl-staining on E16.5 Ctrl and WNT-iGOF coronal brain sections. d Comparison of neocortical thickness of E16.5 Ctrl and WNT-iGOF mice. n = 16 for Ctrl brains and n = 12 for WNT-iGOF brains. Each point represents an individual brain. e Comparison of cortical plate thickness of E16.5 Ctrl and WNT-iGOF mice. n = 10 for Ctrl brains and n = 7 for WNT-iGOF brains. Each point represents an individual brain. f Comparison of dorsal ventricle surface length of E16.5 Ctrl and WNT-iGOF mice. n = 10 for Ctrl brains and n = 7 for WNT-iGOF brains. Each point represents an individual brain. g–i Immunofluorescence (g) and quantification (h, i) of SATB2 + and CTIP2 + of coronal sections of E16.5 Ctrl and WNT-iGOF Ncx. j–n Immunofluorescence (j) and quantification (k–n) of of TBR2 + (red) and PAX6 + (green) cells on boxed area of E16.5 coronal sections (p) of Ctrl and WNT-iGOF Ncx. n = 6 for Ctrl brains and n = 6 for WNT-iGOF brains. Each point represents an individual brain. o–r Immunofluorescence (o) and quantification (p–r) of TBR2 + (red) and Ki67 + (green) cells on boxed area of coronal sections (p) of E16.5 Ctrl and WNT-iGOF Ncx. n = 5 for Ctrl brains and n = 5 for WNT-iGOF brains. Each point represents an individual brain. Quantification data are shown as means ± SEM. Statistical significance was determined using an unpaired two-tailed Student’s t-test (d, e, f, h, i, k–n and p–r). *P < 0.05, **P < 0.01, and ***P < 0.001. ns not significant. Scale bars, 500 μm (c), 100 μm (g, j, o and magnified views in c). 50 μm (magnified views in j and o).

