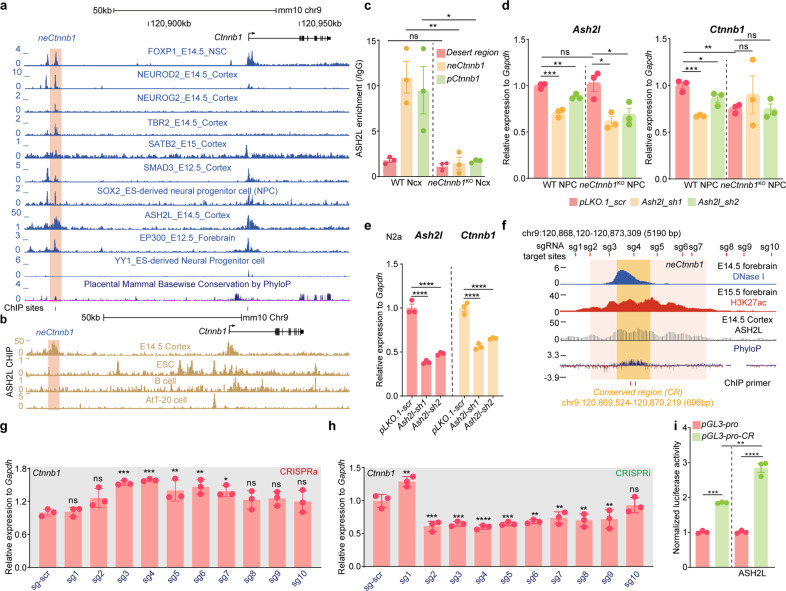
Fig. 5. ASH2L associates with neCtnnb1 and pCtnnb1 to regulate Ctnnb1’s transcription.
a ChIP-seq tracks for enrichment of indicated trans-acting factors in neCtnnb1 in developing Ncx. neCtnnb1 is highlighted. b ChIP-seq tracks for ASH2L in indicated murine cells. neCtnnb1 is highlighted. c ChIP-qPCR of E15.5 WT and neCtnnb1KO Ncx using an anti-ASH2L antibody. n = 3 for WT Ncx and n = 3 for neCtnnb1KO Ncx. Each point represents an individual brain. d RNA levels of Ash2l (left) and Ctnnb1 (right) in WT and neCtnnb1KO neocortical NPCs transfected with indicated vectors for two days. NPCs were derived from E12.5 Ncx. n = 3 for WT brains and n = 3 for neCtnnb1KO brains. Each point represents an individual brain. e RNA levels of Ash2l (left) and Ctnnb1 (right) in Neuro-2a cells transfected with indicated vectors for two days. Each point represents an independent experiment. f Schematic representation the location of neCtnnb1 (pink shading) and conserved region (orange shading) marked by enrichment of H3K27ac, DNase I hypersensitivity and ASH2L in E14.5 brains. Data were obtained from ENCODE. Locations of sgRNA target sites and ChIP primer were indicated. g, h RNA levels of Ctnnb1 in Neuro-2a cells transfected with indicated CRISPRa (g) and CRISPRi (h) vectors for two days. Each point represents an independent experiment. i Luciferase reporter assay in Neuro-2a cells transfected with indicated vectors for two days. Each point represents an independent experiment. Quantification data are shown as means ± SEM. Statistical significance was determined using two-way ANOVA followed by Sidak’s multiple comparisons test. (c, d, e and i); or using one-way ANOVA analysis (g and h). *P < 0.05, **P < 0.01, ***P < 0.001, and ****P < 0.0001. ns, not significant.

