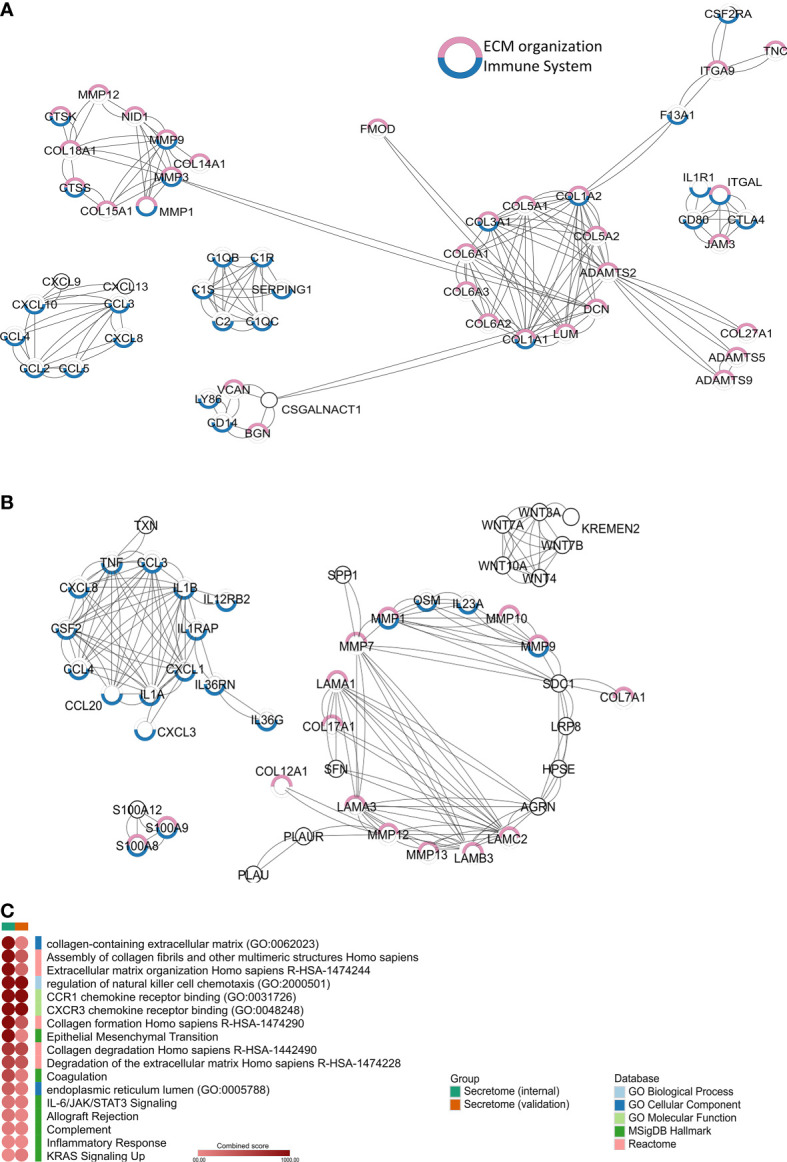
Figure 1.

Secretome profile of penile cancer (PeCa) (A) Protein–protein interactions (PPIs) of secretome genes upregulated in PeCa from the internal dataset (Affymetrix). (B) PPIs of secretome genes upregulated in PeCa from the validation dataset (Agilent). Network generated by STRING (Search Tool for the Retrieval of Interacting Genes/Proteins) using the highest confidence interaction score (0.9). Colored circles indicate the associated ontology; genes associated with the immune system and extracellular matrix (ECM) are highlighted in blue and pink, respectively. Edges represent interaction. (C) Heat-scatter plot of the combined score for the enriched pathways and ontologies. Top categories selected from enrichment analysis of secretome genes from PeCa samples. The intensity of the color in the dotplot indicates the enrichment significance by the combined score. Significant adjusted p-value was found in all included terms. Gene set names are colored according to the Gene Ontology (GO) biological process (light blue), GO cellular component (dark blue), GO molecular function (light green), Kyoto Encyclopedia of Genes and Genomes (KEGG, dark green), MSigDB Hallmark (pink), Reactome (red), and Wiki Pathways (orange).
