Figure 2.
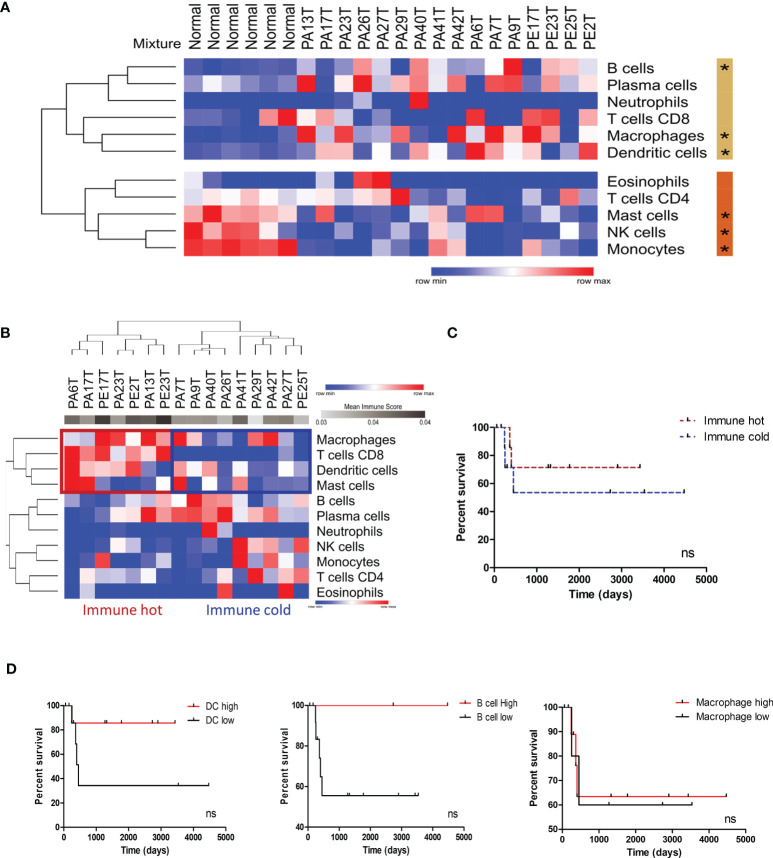
Immune profile characterization of PeCa samples using digital cytometry. (A) Heatmap representative of the immune cell score in normal and PeCa samples calculated using CIBERSORTx. (*) significant p-values comparing tumor versus normal samples. Rows were clustered based on the Euclidean distance of immune score values. Two clusters were generated using K-means analysis (K-means = 2). The beige and orange bars indicate the clusters of cells enriched in PeCa samples and normal samples, respectively. (B) Heatmap representative of immune cell scores in PeCa samples calculated using CIBERSORTx. Rows and columns were clustered based on the one minus Pearson correlation of immune score values. (C) Kaplan–Meier plot of immune hot and immune cold PeCa patients based on Figure 2B. (D) Kaplan–Meier plot of patients presenting high and low scores of dendritic cells (DCs), B cells, and macrophages. The bets cutoffs for survival analysis were determined by the easyROC web tool. (C, D) The Gehan–Breslow–Wilcoxon Test determined the hazard ratio (HR) with 95% confidence intervals (CIs). ns: p-values not statistically significant.

