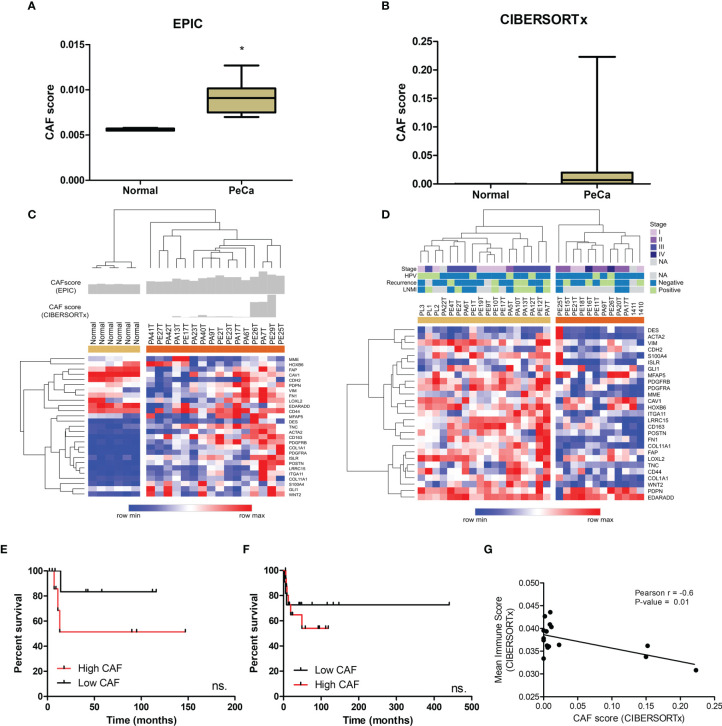
Figure 3.
CAF characterization of PeCa samples using digital cytometry. (A) Bar graph demonstrating the mean score estimated using EPIC. The statistical significance was analyzed using Student’s t-test. *P < 0.001. (B) Bar graph demonstrating mean score estimated using CIBERSORTx. (C) Heatmap representing the gene expression of CAF markers in the internal set of cases (Affymetrix). The top panel indicates the CAF score in normal and PeCa samples calculated using CIBERSORTx and EPIC. Rows and columns were clustered based on the Euclidean distance of CAF marker expression. Three clusters were generated using k-means analysis (K-means = 3). (D) Heatmap representing the gene expression of CAF markers in the validation dataset (Agilent). Rows and columns were clustered based on Euclidean distance of CAFs marker expression. Two clusters were generated using k-means analysis (K-means = 2). (E) Kaplan–Meier plot of patients presenting high and low scores of CAFs (Affymetrix; internal set). (F) Kaplan–Meier plot of patients presenting high and low expression of CAF markers (Agilent; validation set). (E, F) The HR with 95% confidence intervals (CI) was determined by the Gehan–Breslow–Wilcoxon Test. ns, not statistically significant. (G) The partial Pearson’s rank correlation (r) and p-value are given for the CAF score generated by CIBESORTx with the mean immune score also generated by CIBESORTx.

