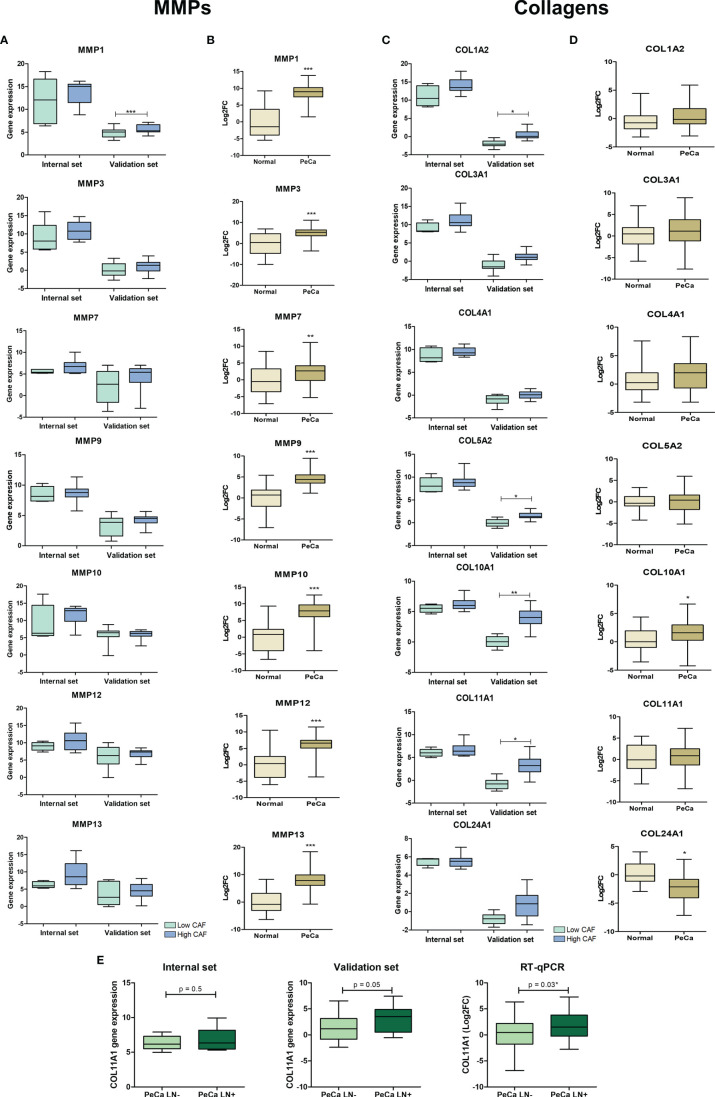
Figure 4.
Expression pattern of matrix metalloproteinases and collagens in PeCa samples. (A) Box plots representative of expression levels of MMP1, MMP3, MMP9, MMP10, MMP12, and MMP13 genes in PeCa compared to normal samples from internal [normalized-expression Robust Multi-ArrayAverage (RMA)] and validation set (expression ratio) according to the CAF score. (B) Box plots showing the expression levels of MMP1, MMP3, MMP9, MMP10, MMP12, and MMP13 in PeCa samples compared to normal tissues using RT-qPCR [log2fold change (2−DDCt) relative to GUSB]. The statistical difference was analyzed by the Mann–Whitney U test. (C) Box plot representative of the expression levels of COL11A1, COL1A2, COL4A1, COL3A1, COL5A2, COL10A1, and COL24A1 genes in PeCa samples from internal (normalized-expression RMA) and validation set (expression ratio) according to the CAF score. (D) Box plots showing the expression levels of COL11A1, COL1A2, COL4A1, COL3A1, COL5A2, COL10A1, and COL24A1 genes in PeCa compared to normal samples using RT-qPCR [log2fold change (2−DDCt) relative to GUSB]. Statistical difference was analyzed by the Mann–Whitney U test. (E) Box plot showing the expression levels of COL11A1 in PeCa compared to normal tissues from internal (normalized-expression RMA), validation set (expression ratio), and RT-qPCR according to lymph node (LN) metastasis. LN+: patients positive for LN metastasis; LN-: patients negative for LN metastasis. Statistical difference was analyzed by Student’s t-test. *p-values < 0.05, **p-values < 0.01, and ***p-values < 0.001.

