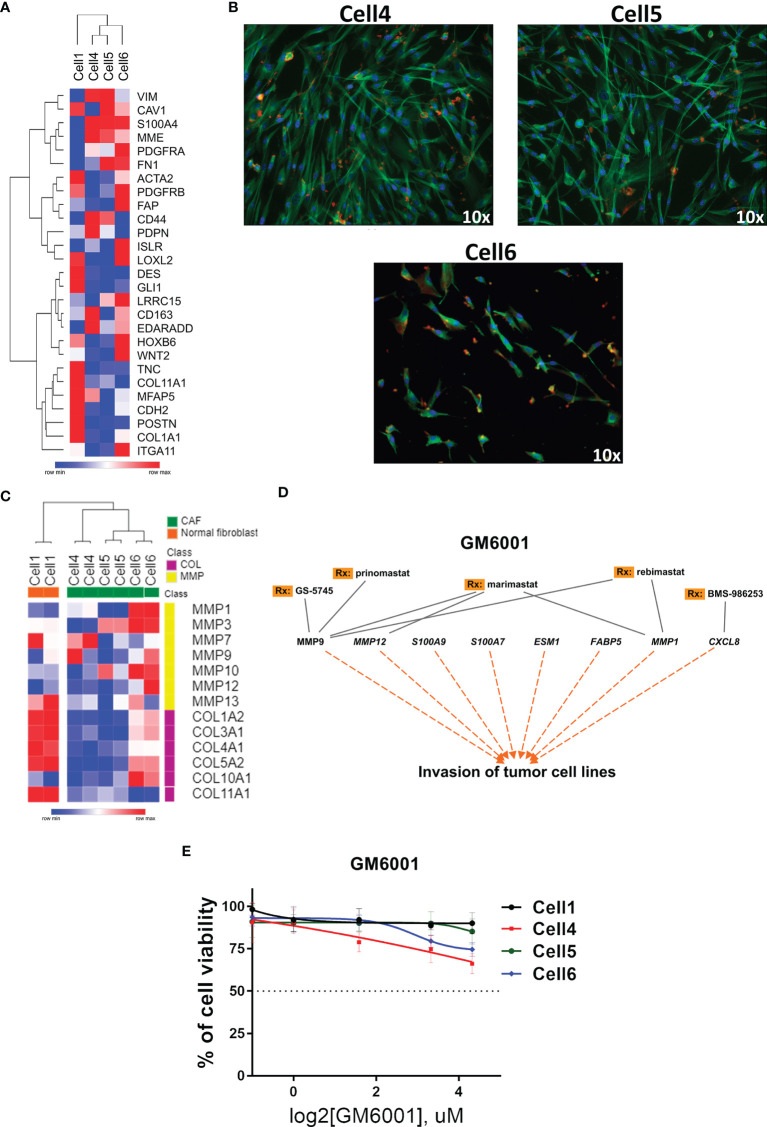
Figure 5.
Targeted therapy in PeCa–derived CAF cells. (A) Heatmap representative of gene expression of CAF markers in PeCa–derived cells (Cell4, Cell5, and Cell6) and normal foreskin cell line (Cell 1). Rows and columns were clustered based on the Euclidean distance of CAF marker expression. (B) Immunofluorescence images (Texas Red: actin/phalloidin; FITC: tubulin; and DAPI: nucleus, ×10 magnification, Nikon TE2000) of CAF cells (Cell4, Cell5, and Cell6). (C) Heatmap representative of the expression levels of MMP and collagen genes (same gene set used in the validation) in PeCa-derived cells (Cell4, Cell5, and Cell6) and Cell1. (D) Potential target therapy for secreted genes, especially MMPs (IPA analysis). (E) Cell viability assay using an MMP inhibitor (GM6001—Pan inhibitor of MMPs) at the indicated concentrations for 24 h to treat Cell1, Cell4, Cell5, and Cell6.

