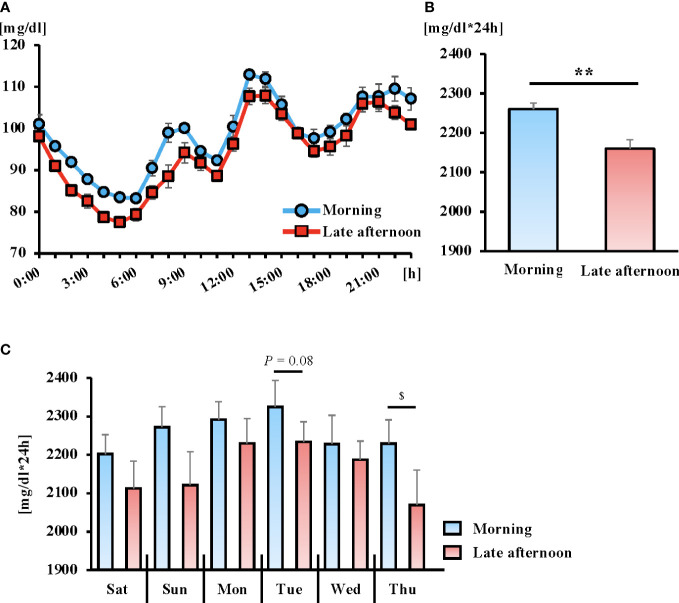
Figure 3.
The 6-day average of the 24-hour blood glucose concentrations (A) and area under the curve (AUC) (B) following the exercise intervention. Daily AUC for 6 days following the exercise intervention (C). Blue and red lines indicate the morning and late afternoon trials, respectively. All data are presented as mean ± standard error. **P < 0.01 compared to the level in the Morning trial (paired t-test). $ P < 0.05 compared to the level in the Morning trial (Wilcoxon). Blood glucose fluctuations were calculated from the 24-hour blood glucose fluctuations after the intervention for each trial (from Saturday to next Thursday). The 24-h glucose variability measurements were taken from 00:00 h to 24:00 h on that day.

