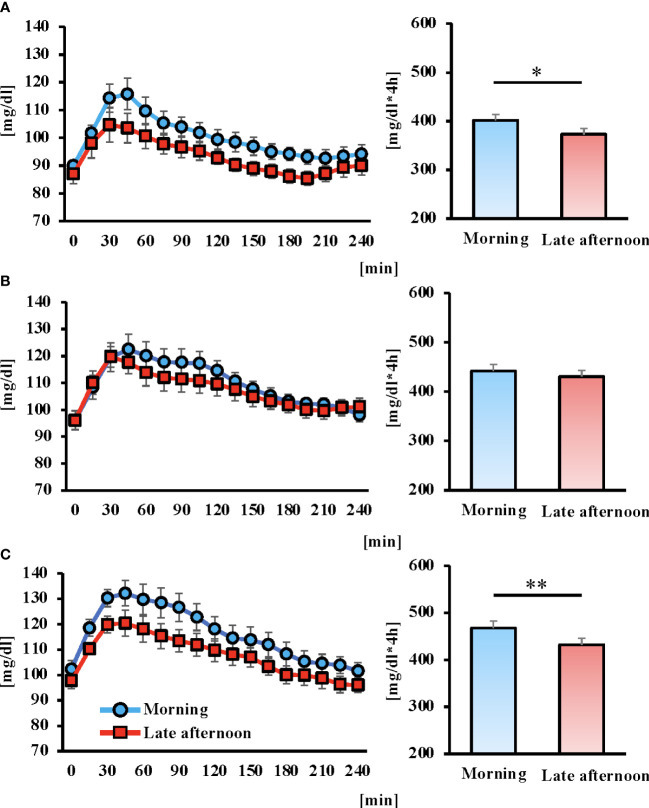
Figure 4.
Concentrations of glucose of postprandial 4 hours and area under the curve (AUC) for 6 days after intervention in each trial. Breakfast (A), lunch (B) Dinner (C), and the blue and red lines indicate the morning and late afternoon trials, respectively. All data are presented as mean ± standard error. *P < 0.05, **P < 0.01 compared to the level in the Morning trial (paired t-test).

