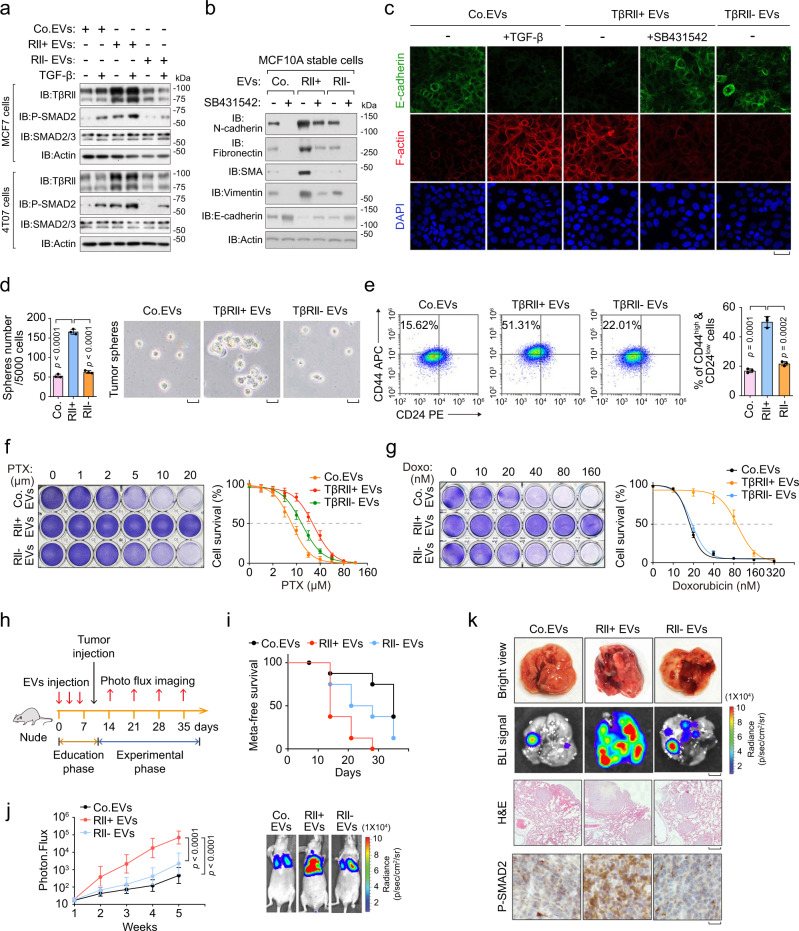
Fig. 5. EV-TβRII promotes breast cancer stemness and metastatic outgrowth.
a Immunoblot analysis of total cells lysates from MCF7 cells (upper panel) or 4T07 cells (lower panel) pre-treated for 24 h with TβRII+ EVs or TβRII− EVs (40 μg) derived from MDA-MB-231 cells, and stimulated with or without TGF-β (5 ng/ml) for 1 h as indicated. b Immunoblot analysis of total cell lysate of MCF10A-RAS cells pre-treated for 48 h with TβRII+ (RII+) EVs or TβRII− (RII−) EVs (40 μg) derived from MDA-MB-231 cells, and treated with or without SB431542 (10 μM) for 48 h as indicated. c Immunofluorescence and DAPI staining of HaCaT cells pre-treated for 48 h with TβRII+ (RII+) EVs or TβRII− (RII−) EVs (40 μg) derived from MDA-MB-231 cells, and treated with or without TGF-β (5 ng/ml) and SB431542 (10 μM) for 48 h as indicated. Scale bars, 20 μm. d MCF10A-RAS cells pre-treated with control EVs, TβRII+ (RII+) EVs, or TβRII− (RII−) EVs (40 μg) derived from MDA-MB-231 cells were analyzed in a tumor sphere assay. Quantification of the number of tumor spheres per 5 × 10³ seeded cells (left panel) and pictures show representative images of tumor spheres (right panel). Scale bar, 2 mm. e FACS analysis (left panel) and Quantification (right panel) of the CD44high/CD24low population in MCF10A-RAS cells treated with Co.EVs, TβRII+ or TβRII− EVs (40 μg) for 48 h. f Cytotoxic crystal violet staining (left) and dose-response curves (right) to paclitaxel (PTX) of MDA-MB-231 cells pre-incubated with Co.EVs, TβRII+ or TβRII− EVs (40 μg) for 48 h. The dose is presented on the x axis, while cell viability (% vs control) is presented on the y axis. g Cytotoxic crystal violet staining (left) and dose-response curves (right) to Doxorubicin (Doxo) of MDA-MB-231 cells pre-incubated with Co.EVs, TβRII+ or TβRII− EVs (40 μg) for 48 h. The dose is presented on the x axis, while cell viability (% vs control) is presented on the y axis. h–k EVs administration and experimental analysis in vivo: 4T07 cells pre-treated with Co.EVs, TβRII+ or TβRII− EVs (40 μg) were tail vein-injected into nude mice (n = 8 mice per group). Mice were also given injection (into the tail vein) of corresponding EVs (50 μg per mouse every other day) before the tumor injection h; the percentage of metastasis-free mice in each experimental group followed in time i; Lung metastasis was measured by BLI. Normalized photon flux (left panel), representative images (right panel) in each experimental group followed in time j; Representative images of bright view (upper), BLI signal (scale bars, 2 mm, middle upper), HE (scale bars, 1 mm, middle lower) and IHC staining (scale bars, 2 μm, lower) in each group k. ns not significant (p > 0.05) and *p < 0.05 (unpaired two-tailed Student’s t test d, e or two-way ANOVA f, g, j). Data are analyzed from three independent experiments and shown as mean ± SD d, e, f, g, j. Source data are provided as a Source Data file.

