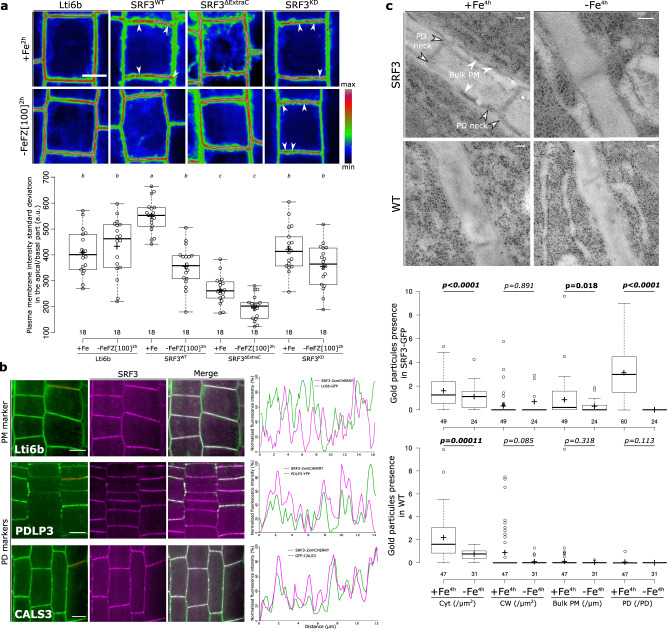
Fig. 3. SRF3 co-exists in two sub-populations at the plasma membrane, which decrease under low iron levels.
a Confocal images of root epidermal cells of 5 day old seedlings expressing p35s::eGFP-Lti6b, pUBQ10::SRF3-mCITRINE, pUBQ10::SRF3WT-mCITRINE, pUBQ10::SRF3ΔExtraC-mCITRINE, pUBQ10::SRF3KD-mCITRINE under iron sufficient (+Fe, 2 h) or low iron (–FeFZ 100 μM, 2 h) conditions and the related quantification [ANOVA with post hoc Tukey test; Letters: statistical differences (p < 0.05)]. Note that the pictures have been pseudo-colored in rainbow RGB and intensities are optimized to emphasize changes in plasma membrane polarity and localization in the punctuated foci. Arrows indicate punctuated structures. Scale bars, 10 μm. b Confocal images of root epidermal cells in the transition-elongation of 5 day old seedlings co-expressing, p35s::eGFP-Lti6b, pPDLP3-PDLP3-YFP, 35s::CALS3-GFP, left, with pUBQ10::SRF3-2xmCHERRY, middle and the relative merge of the two pictures. Red line on the left image indicates where the scan line has been traced. Right panel: graphs showing the signal intensity in both channel on the apical-basal part of the cell along the scan line. This co-localization has been observed on three independent experiments on at least 4 roots. Scale bars, 10 μm. c Electron micrograph of gold particle detected with anti-GFP antibody in plants expressing pSRF3::SRF3-GFP (SRF3) and the related control in Ler-0 background under sufficient (+Fe, 4 h) and low (–Fe, 4 h) iron media and the related quantification [two-ways Mann-Whitney test coupled with Montecarlo correction (p = 0.05)]. Cyt, cytosol; CW, cell wall; PM plasma membrane; PD plasmodesmata. Scale bars, 50 nm.

