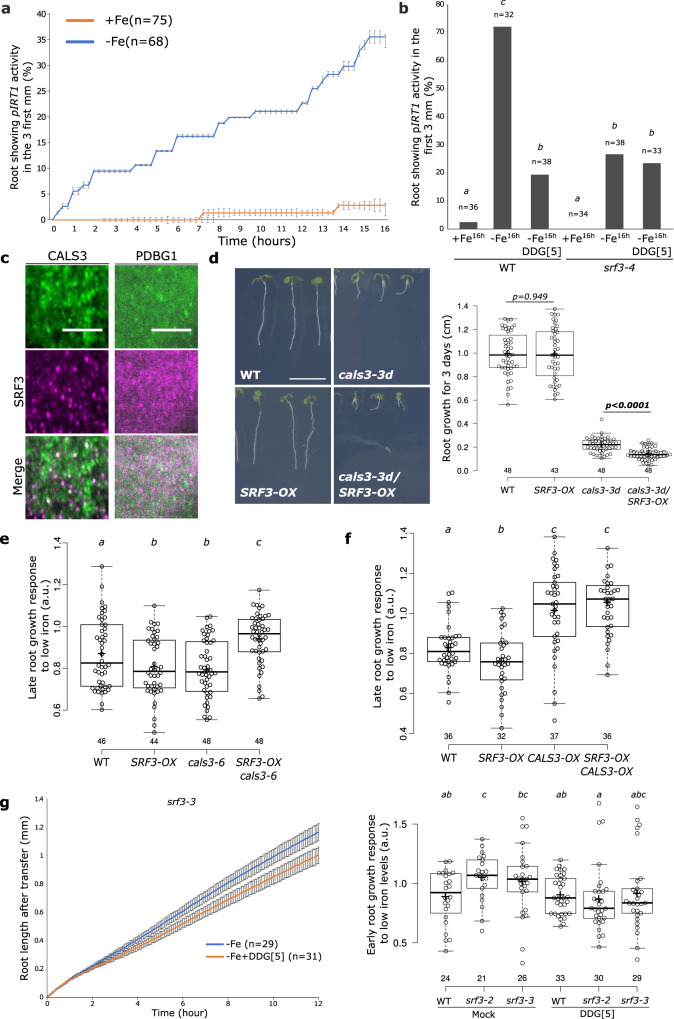
Fig. 5. Regulation of IRT1 and root growth by SRF3-dependent callose synthase activity under low iron levels.
a Graph representing the quantification of pIRT1::NLS-2xYPet time-lapse analysis under mock (+Fe) and low iron levels (–Fe) [error bars indicate Standard error of the mean (SEM)]. b Graph representing the percentage of root showing IRT1 promotor activation under sufficient (+Fe, 16 h) and low (–Fe, 16 h) iron media in WT and srf3-4 in presence or absence of DDG. [ANOVA with post hoc Tukey test; Letters: statistical differences (p < 0.05)]. c Micrographs of 5 day old seedlings taken in the root elongation zone of plants expressing 35s::GFP-CALS3 (upper) and UBQ10::SRF3-2xmCHERRY (middle) and merge channel (lower) acquired by TIRF microscopy. This pattern has been observed on at least 15 roots throughout 2 independent experiments. Scale bars, 5 μm. d Picture of 9 day old seedlings of WT, cals3-3d, pUBQ10::SRF3-mCITRINE (SRF3-OX) and cals3-3d/SRF3-OX and the related quantification [two-ways student test (p < 0.05), n.s. non-significant]. Scale bar, 1 cm. e, f Boxplots of late root growth response of plants grown for 3 days in low iron levels. [ANOVA with post hoc Fisher (e) and Tukey tests (f); Letters: statistical differences (p < 0.05). g Graph showing time-lapse of the root length for 12 h of srf3-3 under low iron (–Fe) media in presence or absence of DDG and the related quantification including the srf3-2 mutant [ANOVA with post hoc Tukey test; Letters: statistical differences (p < 0.05); Error bars indicate SEM].

