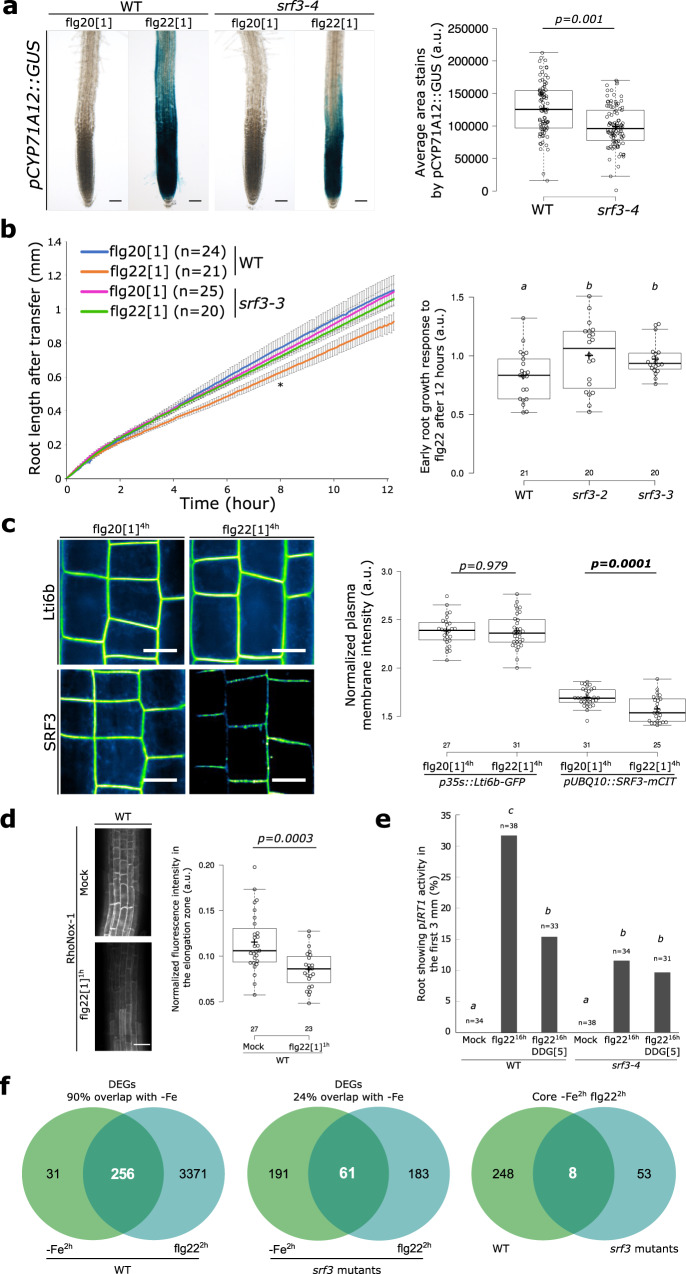
Fig. 6. Coordination of bacterial immunity and iron homeostasis signaling pathways by SRF3.
a Representative pictures of roots expressing pCYP71A12::GUS in WT and srf3-4 under flg20 and flg22 treatment (1 μM, 24 h) and the related quantification [two-ways student test (p < 0.05)]. Scale bars, 50μm. b Graph showing time-lapse analysis of root length of WT and srf3-3 upon flg20 and flg22 treatments (1 μM) [error bars indicates standard error of the mean (SEM); Asterix: first timepoint with significant difference between +Fe and –Fe for the WT according to a mixed effect model (p < 0.05)] and the related quantification including the srf3-2 mutant [ANOVA with post hoc Tukey test; Letters: statistical differences (p < 0.05)]. c Confocal images of root epidermal cells of 5-day-old seedling expressing p35S::eGFP-Lti6b and pUBQ10::SRF3-mCITRINE in flg20 and flg22 (1 μM, 4 h) and the related quantification [two-ways student test (p < 0.05); n.s.: non-significant]. Scale bars, 10 μm. d Confocal images of root epidermal cells of 5 day old seedlings stained with RhoNox-1 in WT in mock or flg22 (1 μM, 1 h) and the related quantification in the elongation zone [two-ways student test (p < 0.05)]. Scale bars, 50 μm. e Graph representing the percentage of root showing IRT1 promotor activation under mock and flg22 (1 μM, 16 h) treatment in WT and srf3-4 in presence or absence of DDG. [ANOVA with post hoc Tukey test; Letters: statistical differences (p < 0.05)]. f Venn diagram of differentially expressed genes under low iron levels (–Fe, 2 h) and flg22 (1 μM, 2 h) in WT (left) in srf3 (middle) and DEGs in both condition between WT and srf3.

