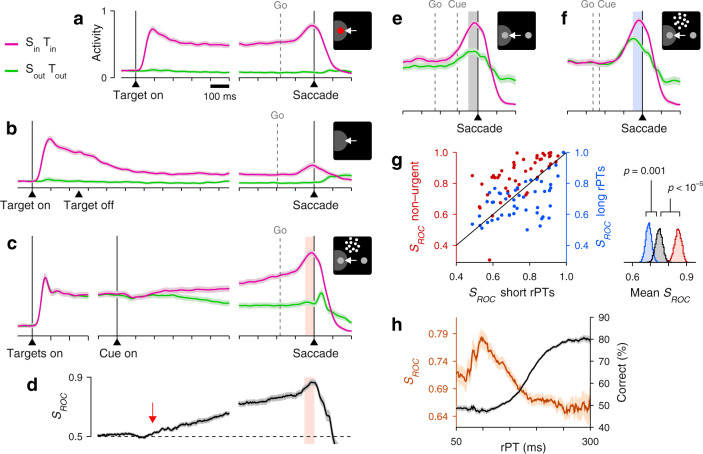
Fig. 2. LIP activity in urgent versus non-urgent random-dot motion discrimination.
a Responses during visually guided saccades. Traces show normalized firing rate (mean ± 1 SE across cells; n = 50) as a function of time for correct trials into (magenta) or away from the cell’s RF (green). Same axes for panels b, c, e, f. The gray dotted line indicates the median onset of the go signal. b Responses during memory-guided saccades (n = 49). c Responses in the non-urgent RDM task (n = 51). d Spatial signal magnitude (mean ± 1 SE) as a function of time for the data in c (same time axis). Throughout the article, SROC measures the statistical separation between inward and outward responses (Methods). Red arrow marks approximate onset of differentiation (190 ms). e Responses in the CRDM task (n = 51) during guesses (rPT ≤ 150 ms). f Responses in the CRDM task during fully informed choices (rPT ≥ 200 ms). g Presaccadic SROC for individual neurons (n = 51) in the non-urgent RDM task (left y-axis), and during guesses (x-axis) and fully informed choices in the CRDM task (right y-axis). Spike counts for computing SROC are from shaded windows in c–f. For each condition, the side plot shows the bootstrapped distribution of the mean SROC across neurons, with p values for differences evaluated via one-sided permutation tests (Methods). h Behavioral (black) and neuronal (brown) performance curves (mean ± 1 SE across trials) from the same CRDM sessions. SROC is from presaccadic spikes pooled across neurons (n = 51) and sorted by rPT (bin width = 51 ms). All data are from correct trials, except for the short rPTs in g, which combine correct and incorrect trials. All motion data are for 100% coherence. Source data are provided as a Source Data file.

