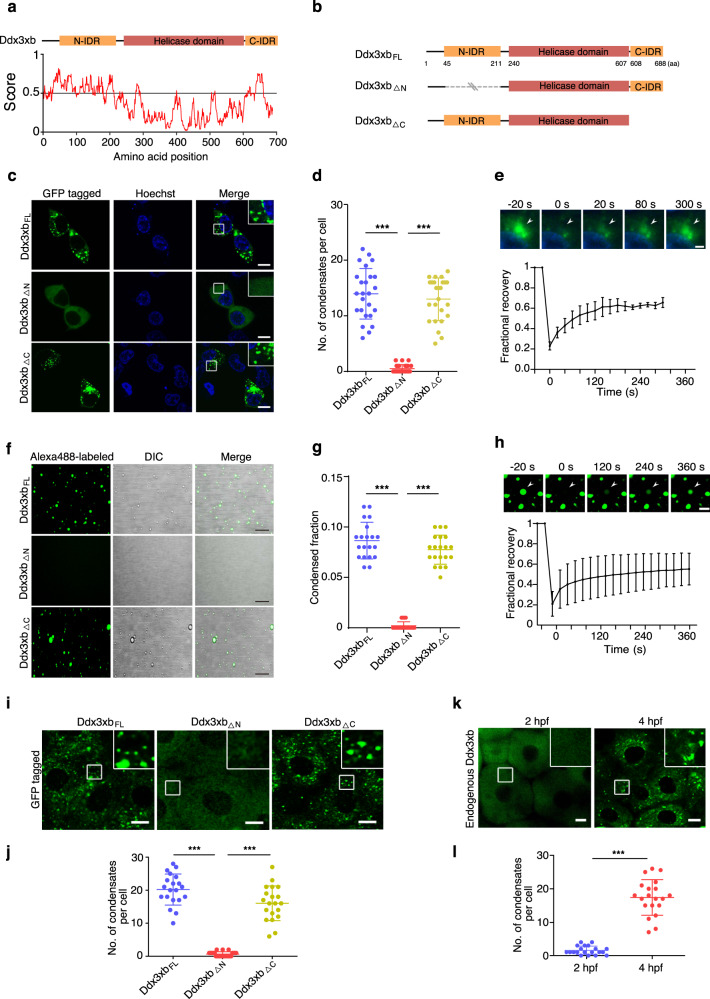
Fig. 1. Zebrafish Ddx3xb forms liquid–liquid phase separation via its N-terminal IDR.
a Bottom, predictions of intrinsic disorder tendency of Ddx3xb by IUPred2A (https://iupred2a.elte.hu/). Scores above 0.5 indicate disorder. Top, schematic diagram showing different truncated forms of zebrafish Ddx3xb. b Schematic diagram showing different truncated forms of zebrafish Ddx3xb. c Expression pattern of N-terminally GFP-tagged Ddx3xb variants (Ddx3xbFL, Ddx3xb△N and Ddx3xb△C) in HEK293 cells. Scale bars, 10 μm. d Quantification of the number of droplets per cell in fluorescence images. n = 25 cells per condition. Error bars, means ± SD. P values were determined by the two-tailed Student’s t-test. ***P < 0.001. e Bottom, plot of fluorescence intensity of GFP-Ddx3xb droplets in HEK293 cells after photobleaching over time. The black curve represents the mean of the fluorescence intensity in the photobleached region in distinct droplets (n = 5); error bars, means ± SD. Top, representative images of fluorescence recovery. Scale bars, 2 μm. f In vitro phase separation of Alexa-488-labeled Ddx3xb variants: Ddx3xbFL, Ddx3xb△N or Ddx3xb△C. Scale bars, 10 μm. g Quantification of condensed phase fraction of Ddx3xb variants as observed in experiments shown in f. The ImageJ software was used for distinguishing the dilute phase and condensed phase by fluorescence intensity difference and condensed phase fraction was measured by calculation of condensed phase area/the given field area. n = 20 fields per condition. Error bars, means ± SD. P values were determined by the two-tailed Student’s t-test. ***P < 0.001. h Top, representative images of fluorescence recovery. Scale bars, 2 μm. Bottom, changes in the fluorescence intensity of Alexa-488-labeled Ddx3xb droplets after photobleaching were plotted over time. The black curve represents the mean of the fluorescence intensity of photobleached regions in distinct droplets (n = 5). Error bars, means ± SD. i Representative images of zebrafish embryos expressing variants of N-terminally GFP-tagged Ddx3xb at 4 hpf. Scale bars, 10 μm. j Quantification of the number of droplets per cell in images obtained from experiments shown in i. n = 20 cells per condition. Error bars, means ± SD. P values were determined by the two-tailed Student’s t-test. ***P < 0.001. k Immunofluorescence staining showing the expression pattern of endogenous Ddx3xb at 2 hpf and 4 hpf. Scale bars, 10 μm. l Quantification of the number of droplets per cell in images obtained from experiments shown in k. n = 20 cells per condition. Error bars, means ± SD. P values were determined by the two-tailed Student’s t-test. ***P < 0.001.

