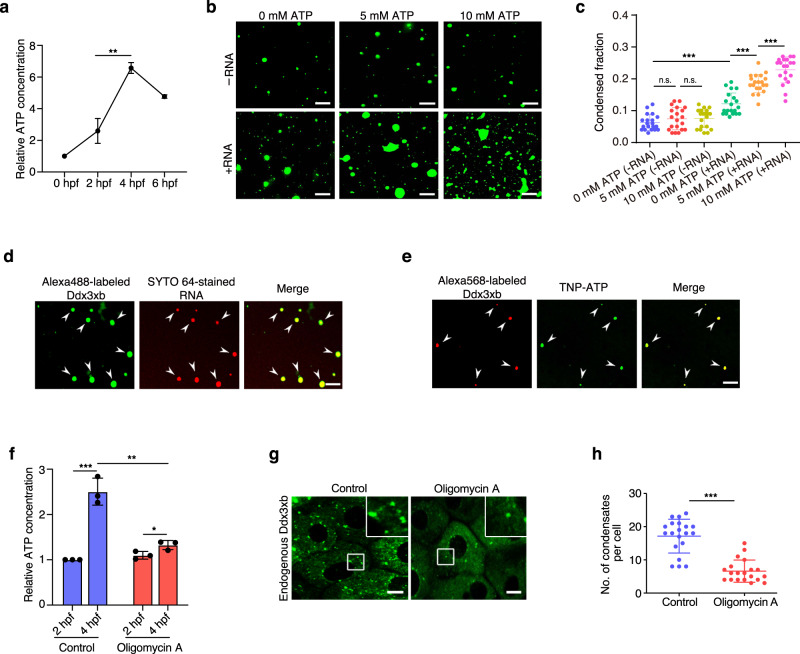
Fig. 2. An increase in ATP concentration promotes both exogenous and endogenous phase separation of zebrafish Ddx3xb.
a Relative ATP concentration during zebrafish embryogenesis, normalized by the ATP concentration at 0 hpf. n = 3 replicates per stage. Error bars, means ± SD. P values were determined by the two-tailed Student’s t-test. **P < 0.01. b Phase separation analysis of full-length Ddx3xb with and without RNA (100 ng/μL) in response to changes in ATP concentration. Scale bars, 10 μm. c Quantification of the phase separation analysis from assays as shown in b. n = 20 fields per condition. Error bars, means ± SD. P values were determined by the two-tailed Student’s t-test. n.s., not significant; ***P < 0.001. d Double-stranded RNA is enriched in Ddx3xb phase separation droplets. Scale bar, 10 μm. e TNP-ATP is enriched in the droplets of Alexa-568-labeled Ddx3xb. Scale bars, 10 μm. f Relative ATP concentration in untreated and Oligomycin A-treated groups, normalized by the ATP concentration of the untreated group at 2 hpf. n = 3 replicates per stage. Error bars, means ± SD. P values were determined by the two-tailed Student’s t-test. *P < 0.05; **P < 0.01; ***P < 0.001. g Immunofluorescence staining showing the expression pattern of endogenous Ddx3xb in control and Oligomycin A treatment groups. Scale bars, 10 μm. h Quantification of the number of droplets per cell in images obtained from assays shown in g. n = 20 cells per condition. Error bars, means ± SD. P values were determined by the two-tailed Student’s t-test. ***P < 0.001.

