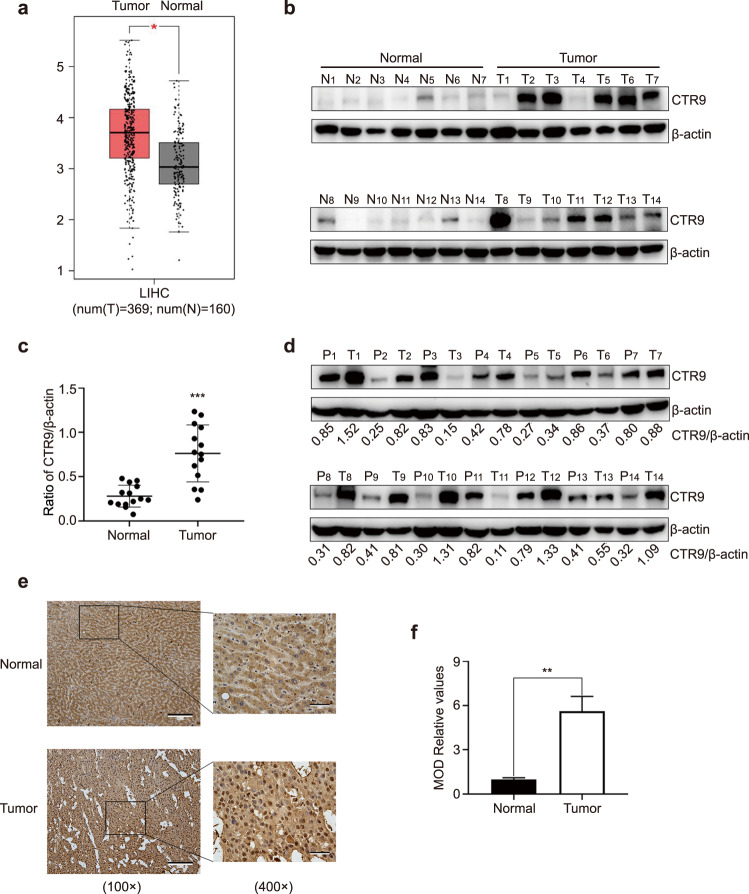
Fig. 1. CTR9 expression in hepatocellular carcinoma (HCC) patients.
a GEPIA database analysis showing that CTR9 mRNA levels are higher in HCC tissues (Tumor) than in non-tumorous liver tissues (Normal) (P < 0.05). b Analysis of total proteins isolated from non-tumorous liver tissues (Normal) and HCC tissues (Tumor) were analyzed using Western blot to assess CTR9 levels. c Statistical analysis of CTR9 expression. Ratios represent CTR9 normalized against β-actin levels in each sample. d Analysis of total proteins isolated from tumor tissue and paired adjacent normal tissues of 14 patients using Western blot to assess CTR9 levels. e Representative images of CTR9 in normal and tumor tissues according to IHC analysis (magnification, ×100 and scale bar, 200 μm; magnification, ×400 and scale bar, 50 μm). f Histogram showing quantitative analysis of relative CTR9 levels. *P < 0.05, **P < 0.01, ***P < 0.001

