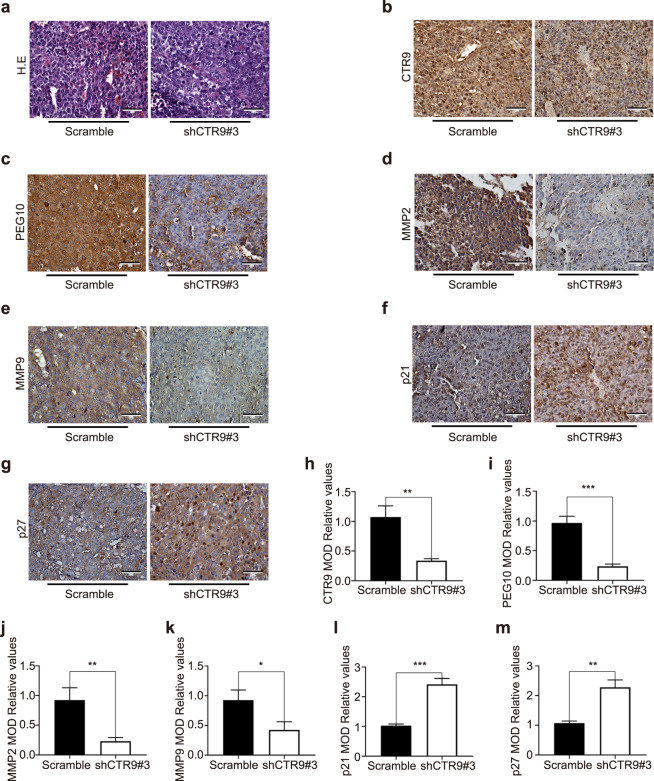
Fig. 7. Protein levels in tumors in vivo.
a Representative images of tumor tissues stained with hematoxylin and eosin. Scale bar, 50 μm. b–g Representative IHC images of CTR9, PEG10, p21, p27, and MMPs in tumor tissues. Scale bar, 50 μm. h–m Histogram showing the quantitative analysis of relative CTR9, PEG10, p21, p27, and MMP levels. *P < 0.05, **P < 0.01, ***P < 0.001

