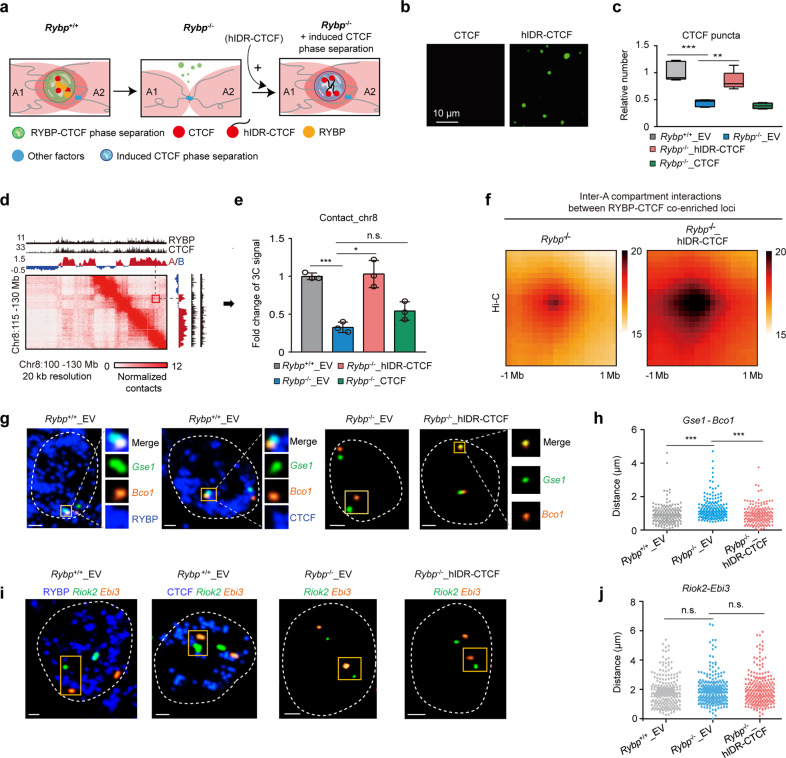
Fig. 5. Induced CTCF phase separation restores inter-A compartment interactions impaired by RYBP depletion.
a Experimental schematic; A1 and A2 denote different A compartments. b Droplet formation of recombinant CTCF and hIDR-CTCF proteins without PEG8000; the protein concentration was 10 µM. c Boxplot showing the relative number of highly concentrated CTCF puncta in different groups. Rybp+/+_EV denotes the empty vector-expressing Rybp+/+ ESCs; Rybp–/–_EV denotes the empty vector-expressing Rybp–/– ESCs; Rybp–/–_hIDR-CTCF denotes the hIDR-CTCF-expressing Rybp–/– ESCs; Rybp–/–_CTCF denotes the WT CTCF-expressing Rybp–/– ESCs. Welch’s t-test; n values are (from left to right): n = 65 cells, n = 133 cells, n = 93 cells. n = 150 cells. P values at top are (from left to right): P = 0.0001551, P = 0.003076. d A representative region of Hi-C contact maps; red fragment showing the contacts between the two A compartments. e 3C-qPCR showing the interaction alteration between two RYBP–CTCF co-enriched loci from different A compartments (red box in d). Welch’s t-test; n = 3. P values at top are (from left to right): P = 0.0004, P = 0.0124, P = 0.0723. f APA plots showing the genome-wide aggregate strength between RYBP–CTCF co-enriched loci from different A compartments after inducing CTCF phase separation (Hi-C data). g DNA FISH coupled with RYBP or CTCF immunofluorescence displaying the distance change between Gse1 (green) and Bco1 (yellow) in different cell lines. The two genes are localized in RYBP–CTCF co-enriched loci. All the scale bars denote 2 μm. h The distance change between Gse1 and Bco1 in different cell lines. Welch’s t-test; Rybp+/+_EV: n = 167; Rybp–/–_EV: n = 154; Rybp–/–_hIDR-CTCF: n = 175. P values are (from left to right): P = 5.12e–07, P = 5.782e–08; Welch’s t-test. i DNA FISH coupled with RYBP or CTCF immunofluorescence displaying the distance change of Riok2 (green) and Ebi3 (yellow) in different cell lines which is used as a negative control. All the scale bars denote 2 μm. j The distance change between Ebi3 and Riok2 in different cell lines. Welch’s t-test; n values are (from left to right): n = 158, n = 179, n = 194. P values are (from left to right): P = 0.3864, P = 0.4016; Welch’s t-test. qPCR data show means ± SD. n.s., not significant, P > 0.05; **P < 0.01; ***P < 0.001.

