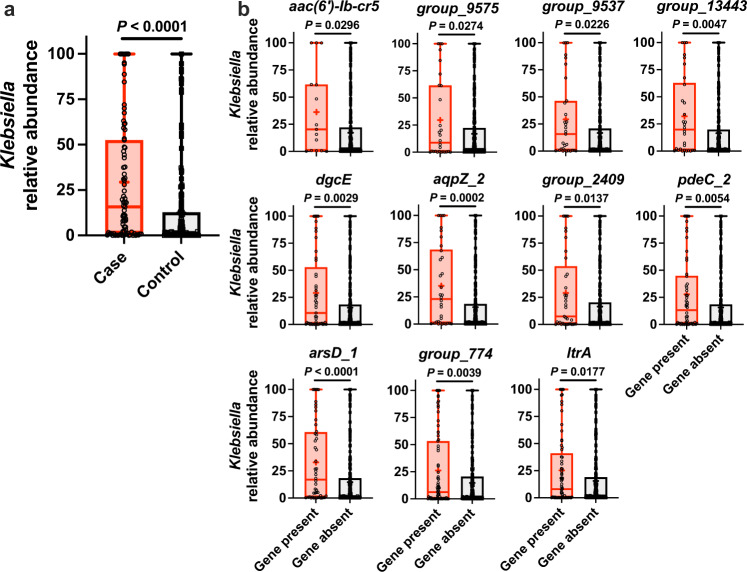
Fig. 3. Specific infection-associated genes are associated with increased Klebsiella gut relative abundance.
a Comparison of Klebsiella gut relative abundance in patient rectal swabs between cases (n = 83) and controls (n = 149, mean displayed, ****P-value ≤ 0.00005, two-sided Student’s t-test) and b in patient rectal swabs stratified by gene presence/absence (25% percentile and 75% percentile bound the box, median displayed as line, mean displayed as plus sign, and range displayed as whiskers, *P-value ≤ 0.05, **P-value ≤ 0.005, ***P-value ≤ 0.0005, ****P-value ≤ 0.00005, two-sided Student’s t-test). Each data point represents a single patient rectal swab. Source data are provided as a Source Data file. Sample sizes for aac(6')-Ib-cr5 present n = 15, aac(6')-Ib-cr5 absent n = 217, group_9575 present n = 28, group_9575 absent n = 204, group_9537 present n = 31, group_9537 absent n = 201, group_13443 present n = 30, group_13443 absent n = 202, dgcE present n = 49, dgcE absent n = 183, aqpZ_2 present n = 34, aqpZ_2 absent n = 198, group_2409 present n = 37, group_2409 absent n = 195, pdeC_2 present n = 54, pdeC_2 absent n = 178, arsD_1 present n = 48, arsD_1 absent n = 184, group_774 present n = 75, group_774 absent n = 157, ltrA present n = 69, and ltrA absent n = 163.

