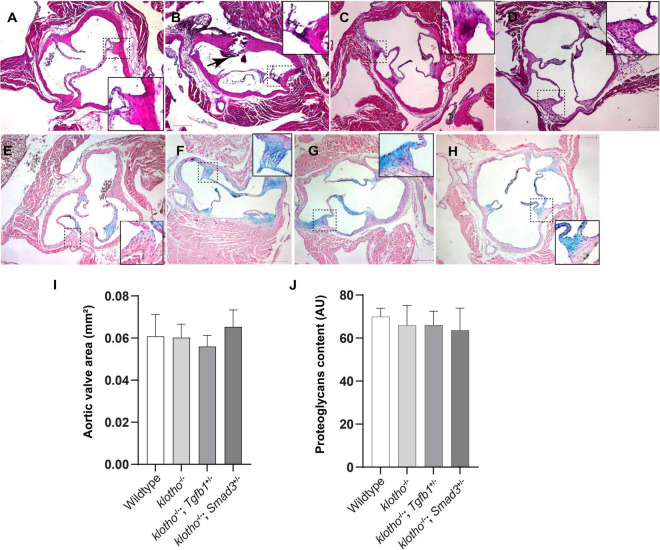
FIGURE 2.
Effect of lowering of TGFβ1 and SMAD3 on AV structure and proteoglycan (GAG) distribution in 10- to 12-week-old Kl–/– mice. (A–D) Hematoxylin and eosin (H&E) staining and (E–H) Alcian blue staining of wild-type, Kl–/–, Kl–/–;Tgfb1±, and Kl–/–;Smad3± mice showing aortic valve histology and proteoglycans distribution. A magnified view showing further details of the boxed region is presented for each image. (I–J) Quantitative analysis of AV area in H&E-stained (I) and proteoglycans content in alcian blue-stained (J) images. Quantification of AV area and GAG content was done on multiple serial sections from each animal per group by using NIH- Image J software. Values indicate mean ± SD (n = 5). Scale bars = (A–H) 200 μm.

