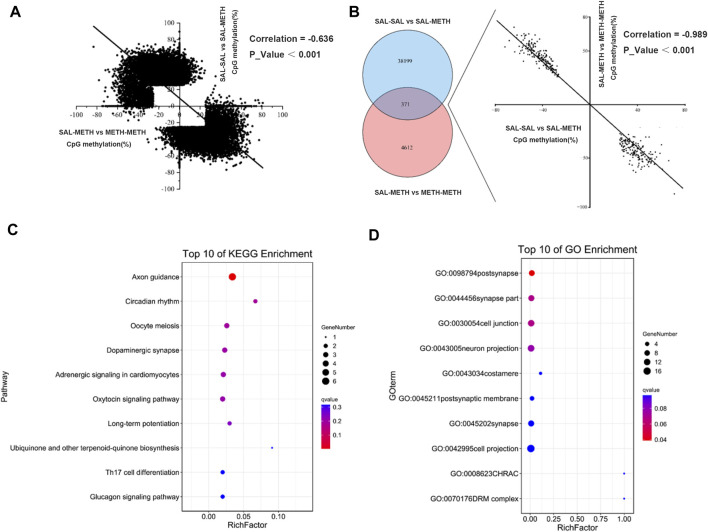
FIGURE 5.
Venn diagram depicting the number of CpGs that are uniquely and commonly affected between postnatal METH exposure and pre- and postnatal METH exposure comparison group. (A) A negative correlation of DMCs between postnatal METH exposure and pre- and postnatal METH exposure comparison group. (B) 371 commonly methylated CpGs (co-methylated) affected by postnatal and pre- and postnatal METH treatments and show a significant negative correlation. (C) Top 10 pathway enrichment results of co-methylated CpG localized genes. (D) Top 10 cellular components of GO enrichment results of co-methylated CpG localized genes. Hypergeometric distribution test was used. Data in each group are based on n = 3.

