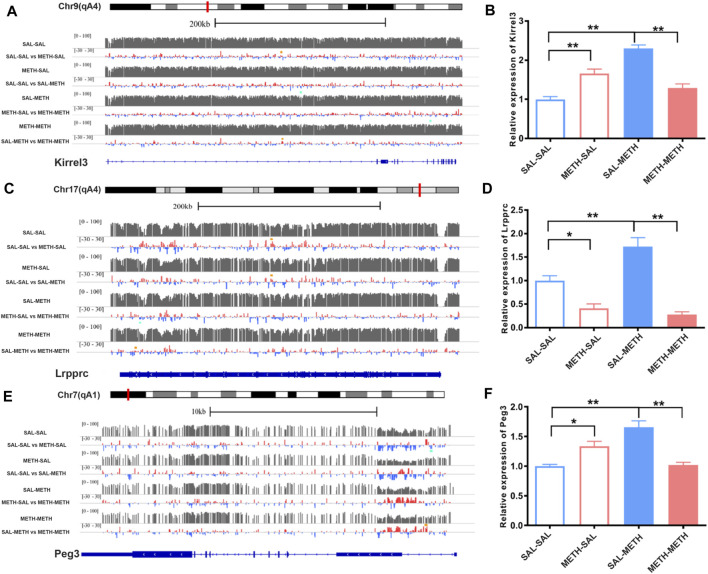
FIGURE 6.
Illustration of DNA methylation changes of Kirrel3, Lrpprc, and Peg3 genes in NAc of prenatal or postnatal METH-exposed males. Left panel (A,C,E) shows expanded views of DNA methylation patterns for sample gene loci, visualized using the UCSC genome browser: Kirrel3; Lrpprc; and Peg3. For each gene, tracks 1, 3, 5, and 7 show the average methylation intensity of the saline group, prenatal METH group (METH-SAL), postnatal METH group (SAL-METH), and pre- and postnatal METH group (METH- METH) respectively. Tracks 2, 4, 6, and 8 show average methylation differences between the two experimental conditions. Green dots represent regions significantly hypo-methylated corresponding to the correspondence control track. Orange dots represent regions significantly hyper-methylated corresponding to the correspondence control track. DMRs were considered differentially methylated if their FDR was at most 0.05. The last track shows exons and introns based on the mouse NCBI RNA reference sequences collection (RefSeq). Right panel (B,D,F) shows changes in expression of Kirrel3, Lrpprc, and Peg3 genes in NAc of prenatal or postnatal METH -exposed males. one-way ANOVA followed by a Bonferroni post hoc test was used. *p < 0.05,**p < 0.01 compared with the corresponding control mice, respectively. SAL-SAL, pre- and postnatal SAL exposure; METH-SAL, prenatal METH and postnatal SAL exposure; SAL-METH, prenatal SAL, and postnatal METH exposure; METH-METH, pre- and postnatal METH exposure. Data in each group are based on n = 3. qPCR data are presented as Mean ± SEM.

