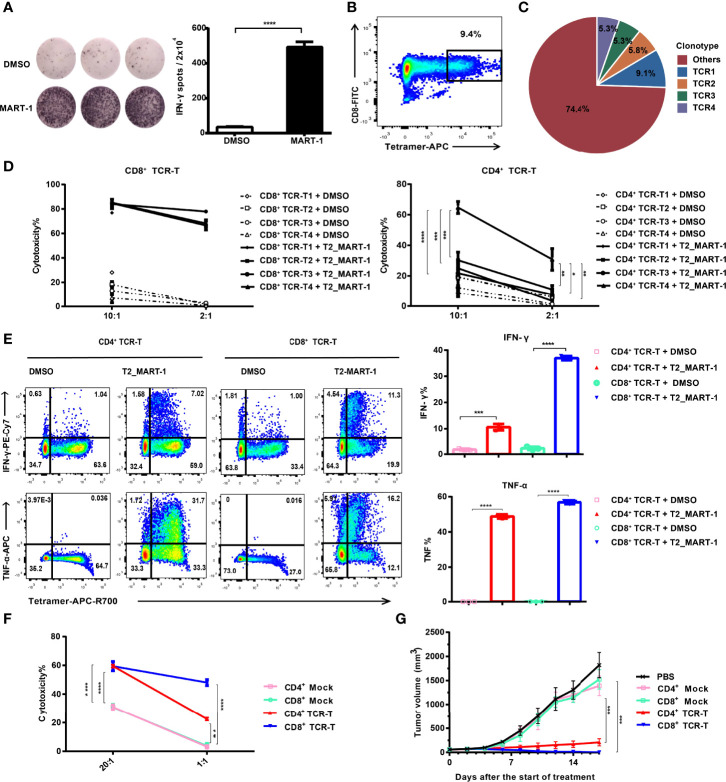
Figure 1.
Construction and functional validation of MART-127-35-specific CD4+ TCR-Ts. (A) IFN-γ ELISPOT results after co-culture of CD8+ T cells with MART-127-35 or DMSO-pulsed T2 cells. (B) FACS sorting of MART-127-35-specific T cells stained with tetramers. (C) Pie chart of TCR clonotype frequency from single-cell V(D)J sequencing. (D) Cytotoxicity of CD8+ TCR-Ts and CD4+ TCR-Ts expressing top4 TCR clonotypes to MART-127-35 or DMSO-pulsed T2 cells. (E) Cytokine production by CD8+ TCR-Ts and CD4+ TCR-Ts stimulated with MART-127-35 or DMSO-pulsed T2 cells. (F) Killing of A375MART-1 melanoma cell line by CD4+ and CD8+ TCR-Ts. (G) Mean tumor growth curves of five groups after treatment. NOG mice were implanted with A375MART-1 subcutaneously. Mice were divided into five groups after 7 days, and received different treatment through peritumoral injection at day 0 (start of treatment) and day 7: PBS (n = 5), CD4+ mock T (n = 3, 3.0×10⁷), CD4+ TCR-T (n=5, 3.0×10⁷), CD8+ mock T (n = 5, 3.0×10⁷) and CD8+ TCR-T (n = 5, 3.0×10⁷). Tumor volume was calculated every 2 days. (A-F), groups were compared with a two-sided, unpaired t-test. (G), groups were compared with the one-way ANOVA analysis. Error bars denote the SD. *:P < 0.05; **:P < 0.01; ***:P < 0.001; ****:P < 0.0001.

