Figure 2.
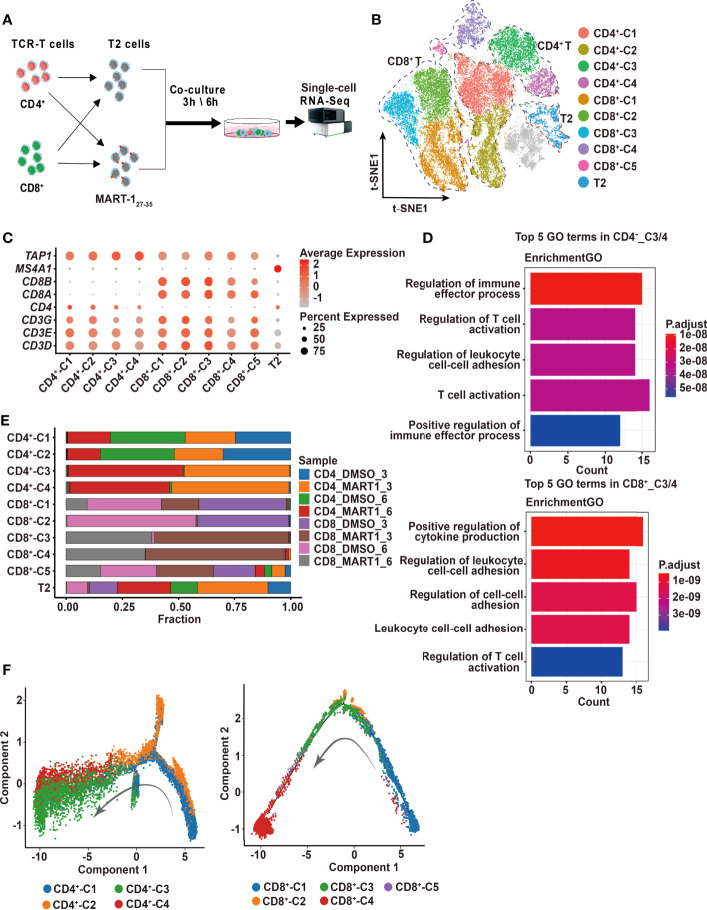
Single-cell profiling of CD4+ and CD8+ TCR-Ts cocultured with target cells. (A) Flow chart of the single-cell RNA sequencing experimental design. (B) t-SNE visualization of the expression profiles of the 43,368 cells that passed quality control. Clusters pertaining to CD8+ T cells, CD4+ T cells and T2 cells were illustrated by dotted lines. Grey refers to undefined cells. (C) Dot plot depicting the average expression and percent of cells expression maker genes for each given cluster. CD3D/E/G for T cells, CD4 for CD4+ T cells, and CD8A/B for CD8+ T cells. TAP1 and MS4A1 are negative and positive markers of T2 cells, respectively. (D) GO pathway analysis of CD4+_C3/C4, CD8+_C3/C4 compared with CD4+_C1/C2 or CD8+_C1/C2/C5 (FC > 1.0, P < 0.05). The color key from red to blue indicates P values from low to high. Count represents the number of genes enriched to this GO entry from the input gene for enrichment analysis. (E) Stacked bar chart of sample proportions in each cluster. (F) Pseudotime trajectory plots of CD4+ T (left) or CD8+ T cells (right) across the pseudotime trajectory. Each point corresponds to one single cell. Each color represents one cell cluster. GO, gene ontology. t-SNE, t-distributed stochastic neighbor embedding.

