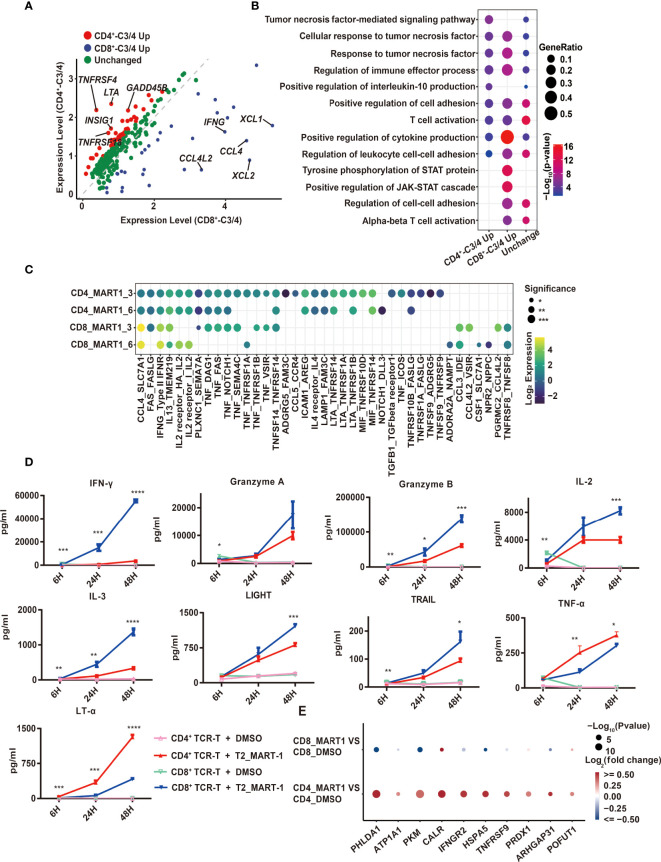
Figure 3.
Comparison of CD4+ and CD8+ TCR-T cytotoxic programs through scRNA-seq analysis and cytokine release measurement. (A) Volcano map of differentially expressed genes between CD4+_C3/C4 and CD8+ _C3/C4 using 252 genes. Red dots indicate genes upregulated in CD4+_C3/C4 and blue dots indicate genes upregulated in CD8+_C3/C4. Green dots indicate genes with no significant change between CD4+_C3/C4 and CD8+_C3/C4 (FC>1.5, P < 0.05). (B) Representative GO terms enriched based on differentially expressed genes as shown in (A). The circle size indicates the gene ratio of the gene number enriched in the GO term divided by the total genes in the group (CD4_C3/C4 Up, CD8_C3/C4 Up, Unchanged). The color key from red to blue indicates P values (P < 0.05) from low to high. (C) Cell-cell communication analysis of TCR-Ts with T2 target cells (the ligand expressed in T cell functional clusters while the receptor expressed in target cells). The circle color indicates the log-scaled (base = 2) expression of each ligand-receptor pair, the circle size indicates the significance. (D) Cytokine secretion of TCR-Ts stimulated with MART-127-35 or DMSO-pulsed T2 cells measured by Luminex. Statistical significance between the CD4+ and CD8+ TCR-Ts stimulated with MART-127-35 groups was determined by an unpaired, two-tailed Student’s t-test. *: P < 0.05, **: P < 0.01, ***: P < 0.001. GO, gene ontology. (E) Genes downstream of LTA signaling pathway were significantly up-regulated in T2 cells.

