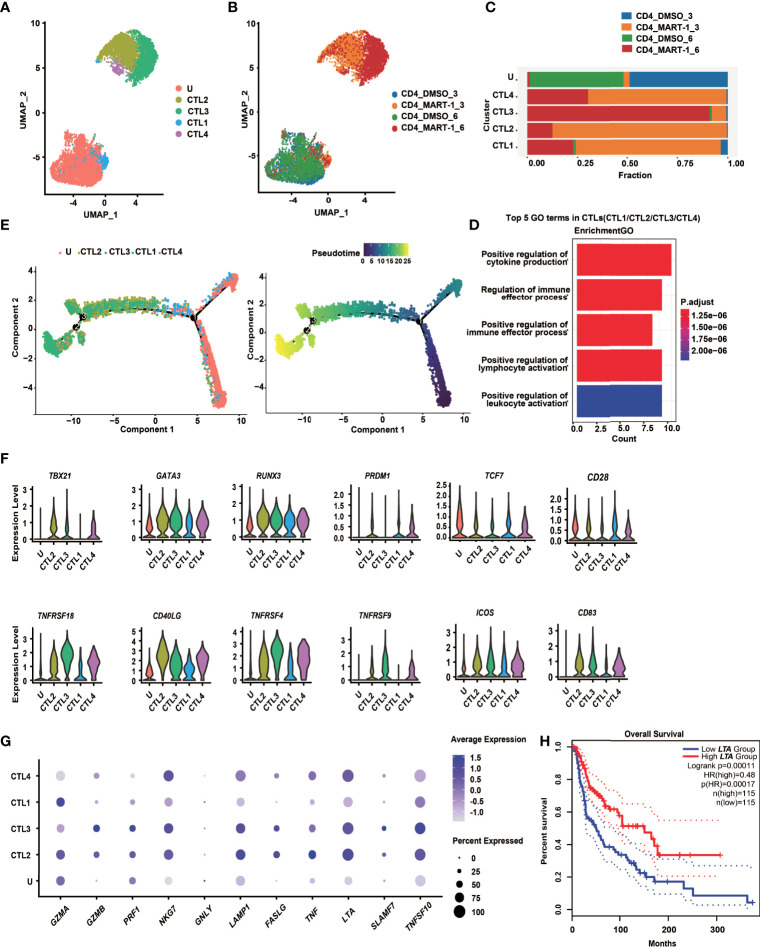
Figure 4.
CD4+ TCR-T clusters showed temporal transcriptome profiles, mixed Th1/Th2 phenotypes and unique cytotoxic signatures. (A)UMAP projection of the expression profiles of the 7825 CD4+ TCR-T cells. (B) UMAP manifolds colored by sample origins. (C) Stacked bar chart of sample origins in each CD4+ TCR-T cluster. (D) GO pathway analysis of CTL1/2/3/4 compared with cluster U. Top 30 DEGs were used for analysis. Top 5 GO-BP terms were displayed. The color key from red to blue indicates P values (P < 0.05) from low to high. Count: The number of genes enriched to this GO entry from the input gene for enrichment analysis. (E) Pseudotime trajectory plot of CD4+ TCR-T cells across the pseudotime trajectory. (F) Violin plots show expression of selected transcription factors and costimulatory molecules in CD4+ TCR-T clusters. (G) Dot plots show expression of representative cytotoxic genes in CD4+ TCR-T clusters. (H) Kaplan-Meier overall survival curves of TCGA SKCM patients grouped by LTA expression. P value was calculated by a log-rank test. DEG, differential expressed gene; GO, gene ontology; UMAP, uniform approximation and projection; BP, biological process.

