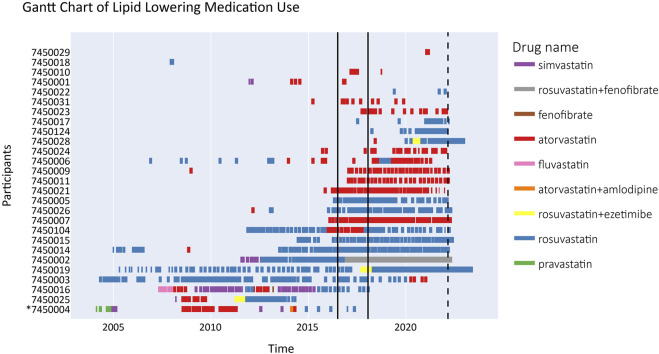
FIGURE 2.
Gantt chart depicting lipid lowering treatment for recalled participants from 2004 until 2022 (n = 27). The time period between the two solid black lines signifies the period of RbG visits (2016–2018) in the Alver et al. study. The dashed line signifies the end of the drug prescription registry follow-up. The lines crossing the end of follow-up indicate purchase of a significant stock of medication in advance. Drug name here indicates the active substance of the prescribed LLT, not the brand name. Participant #7450004 passed away in 2018 (denoted by *).

