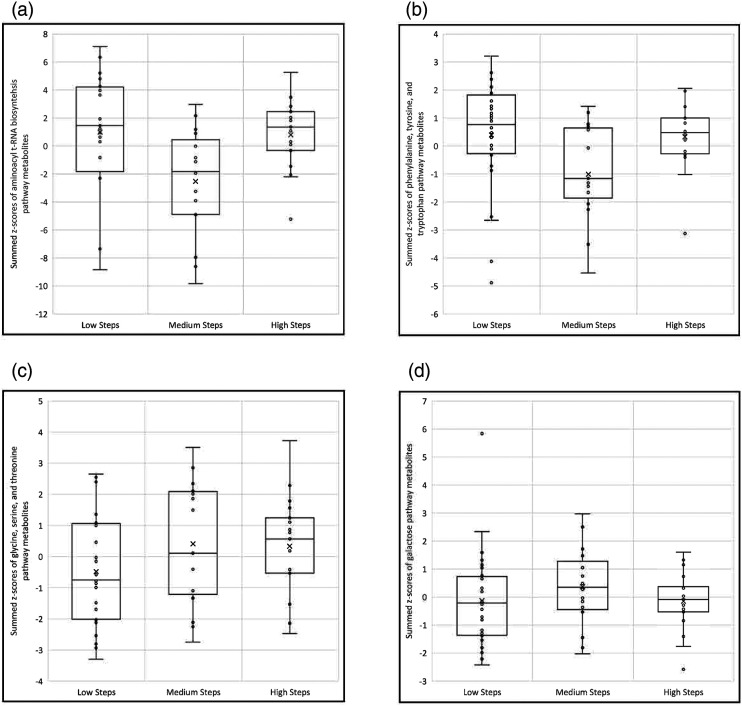
Figure 1.
Boxplots of metabolic pathway scores (i.e., summed z-scores of pathway metabolites) by average steps-per-day categories (low <10,000; medium = 10,000–15,000; high >15,000). A) Aminoacyl t-RNA biosynthesis metabolic pathway (asparagine, phenylalanine, methionine, valine, tryptophan, and tyrosine metabolites). B) Phenylalanine, tyrosine, and tryptophan metabolic pathway (phenylalanine and tyrosine metabolites). C) Glycine, serine, and threonine metabolic pathway (betaine, 3-phosphoglyceric acid, glyceric acid, and glyoxylic acid metabolites). D) Galactose metabolic pathway (galactose and myoinositol metabolites). The Phenylalanine metabolic pathway shared the same metabolites with the phenylalanine, tyrosine, and tryptophan metabolic pathway.

