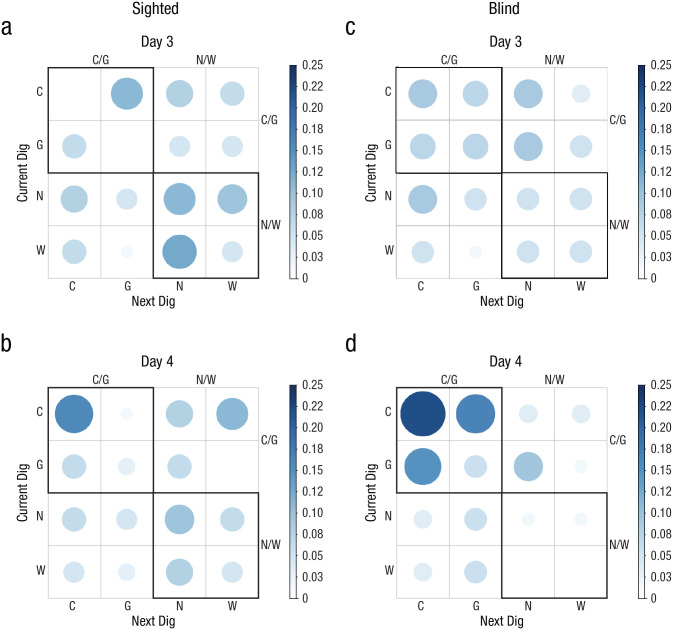
Fig. 5.
Experiment 3: results of the probability analysis of digging sequence in the artificial-cliff-with-3D-edge condition, separately for sighted mice (a, b) and blind mice (c, d) on Day 3 and Day 4 (upper and lower rows, respectively, for each group of subjects). The bar on the right of each graph indicates probability. Larger, darker circles indicate higher probability; smaller, lighter circles indicate lower probability. C = correct corner; G = geometrically equivalent corner; N = near location to rewarded cup; W = wrong location.

