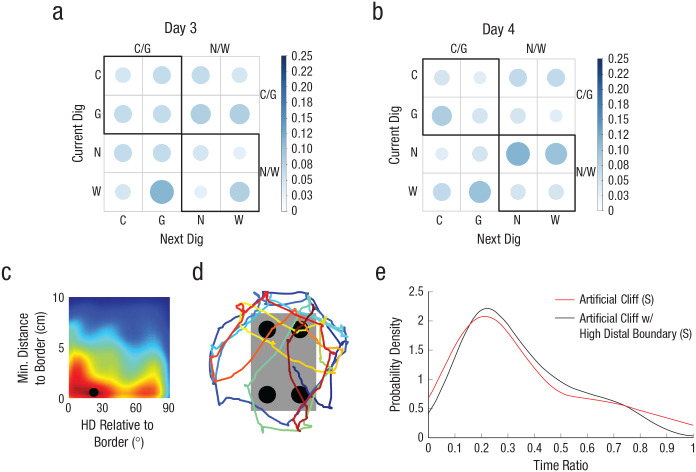
Fig. 8.
Experiment 4: results of the sequential digging probability and path analysis in the artificial-cliff-with-high-distal-rectangular-boundary condition in sighted mice. Sequential digging probability is shown for Day 3 (a) and Day 4 (b). The bar on the right of each graph indicates probability. Larger, darker circles indicate higher probability; smaller, lighter circles indicate lower probability. C = correct corner; G = geometrically equivalent corner; N = near location to rewarded cup; W = wrong location. The average heading direction (HD) relative to the border is shown in (c). Along the x-axis indicates, 0° indicates parallel and 90° indicates perpendicular heading to the border. The black dot indicates the location of the highest value for head direction and distance to border. A sample path illustrating border crossings rather than parallel patrolling is shown in (d). The time-ratio density distribution (e) shows the amount of time sighted mice spent at the border in each condition. Sighted (S) mice: n = 9.

