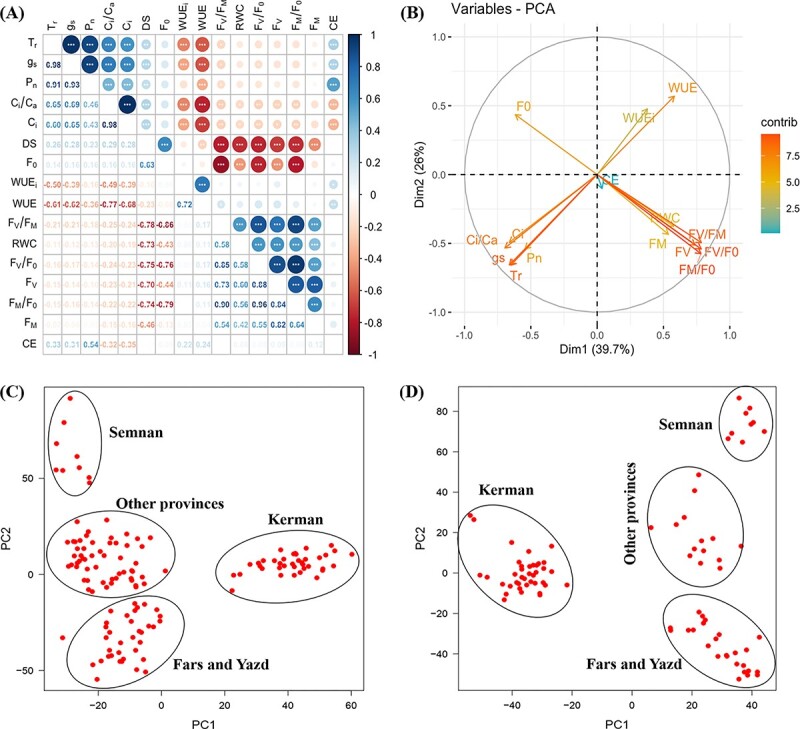
Figure 2.

Correlation plot of photosynthetic traits and principal component analysis (PCA) plots of phenotypic data and SNP markers. (A) Correlation coefficient of plasticity in trait value (DSI), between all gas exchange and chlorophyll fluorescence phenotypes in the 140 walnut families grown in a common garden under severe water stress condition in the first-year experiment. The colour spectrum, bright blue to bright red represents highly positive to highly negative correlations. Stars in circle indicate the significance of correlations (*P ≤ 0.05, **P ≤ 0.01, and ***P ≤ 0.001). (B) Principal component analysis of photosynthetic traits with the first two components showing variation in plasticity in trait value in the 140 walnut families grown in a common garden under severe water stress condition in the first-year experiment. The traits coloured by red contributed more to the variation explained by PC1 and PC2, than those coloured by blue. (C) PCA of the 140 Persian walnut families using 44 207 GBS-derived SNPs (PGBS). (D) PCA of the 87 Persian walnut mother trees using 40 828 GBS-derived SNPs (MGBS). See Table 1 for the definition of measured traits.
