
Fig. 4.
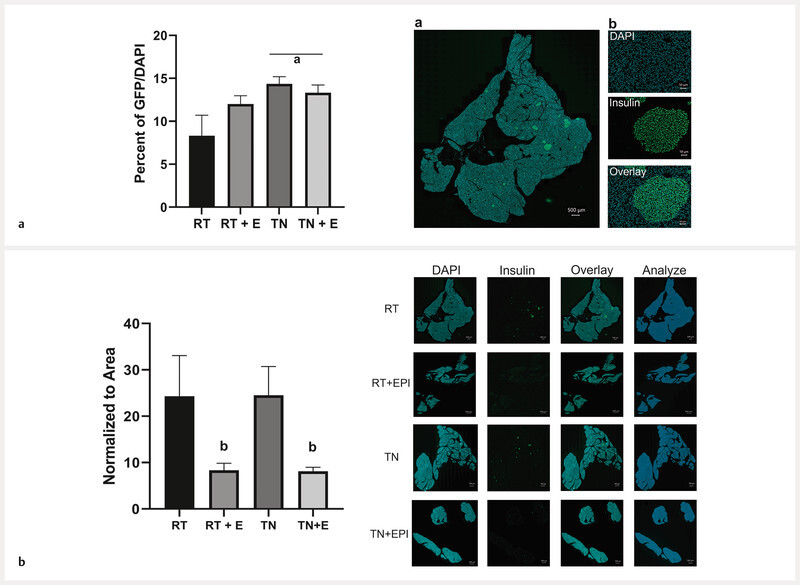
MATLAB analysis of islet insulin-positive cells ( a ), and pancreas stained for insulin ( b ). Animal pancreases were preserved in paraffin and sacrificed after 16 weeks, then stained for insulin using immunohistochemistry. Insulin-positive cells/DAPI per islet were quantified as a percentage of area analyzed ( a ). Stitched image of whole pancreatic tissue section ( a b). Representation of insulin-positive islet cell analysis taken from the whole tissue section ( a b) including cell nuclei stained with DAPI, insulin stained with GFP, and the overlay of both together. Insulin was quantified per total tissue area by analyzing the insulin antibody fluorescent signal and normalizing to that of the entire tissue area ( b ). Results of the two-way ANOVA test are depicted as effect of a p < 0.05 temperature, b EPICAT, and interaction of c EPICAT × temperature. Data were analyzed with a two-way ANOVA and presented as the mean ± SEM, n = 7 – 8.