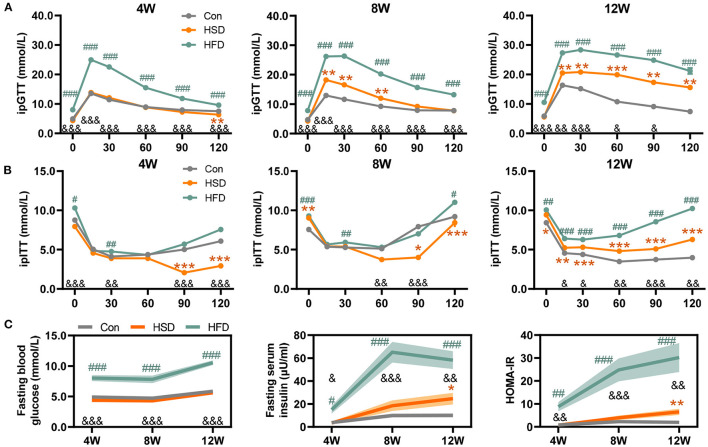
Figure 2.
High-fat or high-sugar diet-induced the impaired glucose tolerance in mice. (A) Glucose tolerance test (GTT) was performed at 1 week before 3 time points (mmol/L). (B) Insulin tolerance test (ITT) was performed 3–4 days after each GTT test (mmol/L). (C) Fasting blood glucose level (mmol/L), fasting serum insulin level (μU/ml), and HOMA-IR (fasting blood glucose level * fasting serum insulin level / 22.5). Data are represented as the mean ± SEM. n = 7-15; *p < 0.05, **p < 0.01, ***p < 0.001 (HSD vs. Con); #p < 0.05, ##p < 0.01, ###p < 0.001 (HFD vs. Con); &p < 0.05, &&p < 0.01, &&&p < 0.001 (HFD vs. HSD).

