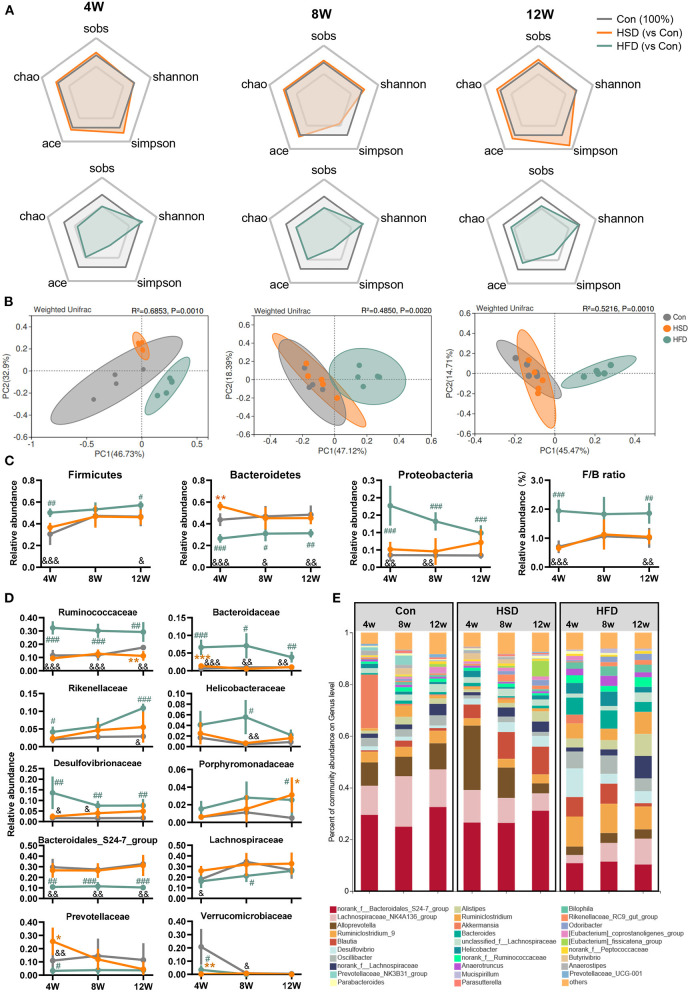
Figure 3.
High-fat diet, but not high-sucrose intake resulted in dramatic alteration of gut microbiome. Fecal samples of Con, HSD, and HFD groups at three time points were analyzed with 16S rRNA gene sequencing. (A) The relative change in α diversity index, including Sobs, Chao, Ace, Simpson, and Shannon index, normalized with Con group (100%). (B) Weighted UniFrac based PCoA analysis among groups with permutational multivariate analysis of variance (PERMANOVA). (C) Relative abundance of bacteria at phylum level and Firmicutes/Bacteroidetes (F/B) ratio. (D) Relative abundance of top 10 abundant family. (E) Bacterial taxonomic profiling at genus level. Data are represented as the mean ± SEM. n = 4-5; *p < 0.05, **p < 0.01, ***p < 0.001 (HSD vs. Con); #p < 0.05, ##p < 0.01, ###p < 0.001 (HFD vs. Con); &p < 0.05, &&p < 0.01, &&&p < 0.001 (HFD vs. HSD).

