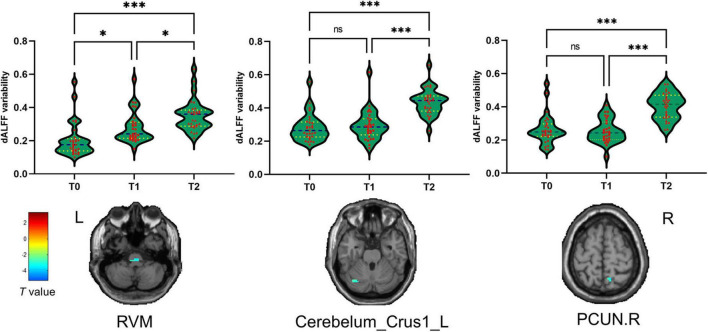
FIGURE 3.
The dALFF variability significantly during the different periods of treatment. *p < 0.05, ***p < 0.001. The cool color represents decreased dALFF variability values. T0, the time point at baseline; T1, the time point after the first acupuncture session; T2, the time point after the 12th acupuncture sessions. All abbreviations are defined in the Abbreviations section.

