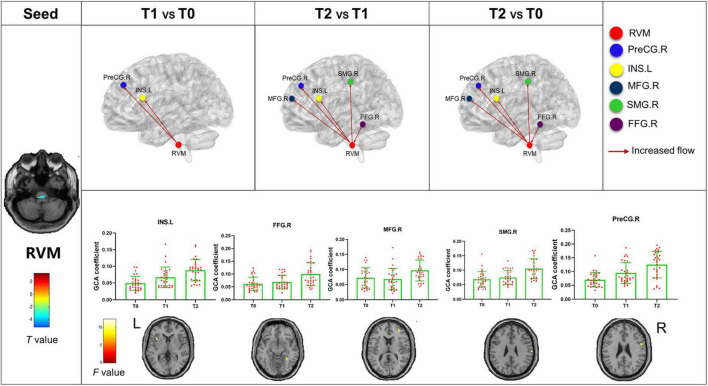
FIGURE 4.
Abnormal effective connectivity pathways associated with the RVM. Each bar chart reflects the values of the dynamic GCA coefficient in the corresponding group. Fuchsia arrows indicate significantly enhanced DEC variability. T0, the time point at baseline; T1, the time point after the first acupuncture session; T2, the time point after the 12th acupuncture sessions. All abbreviations are defined in the Abbreviations section.

