
FIGURE 1.
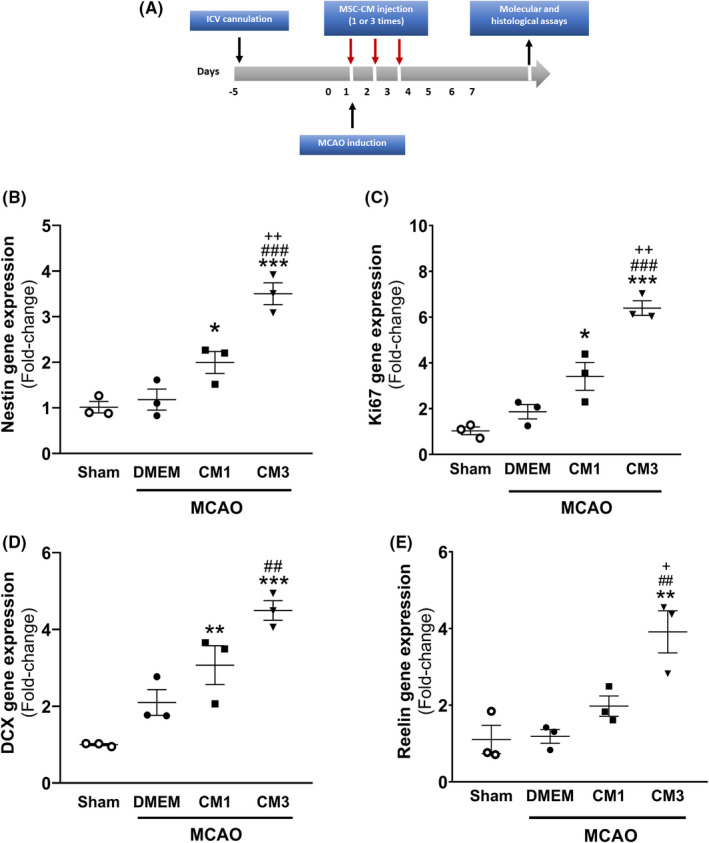
Effect of hESC‐MSC‐CM on mRNA levels of neurogenesis markers. (A) Schematic diagram of the experimental procedure. qPCR data analysis of (B) Nestin, (C) Ki67, (D) DCX, and (E) Reelin in the hippocampus. Data are reported as the mean ± SEM (n = 3). The differences between groups were determined by ANOVA followed by Tukey test. *p < 0.05, **p < 0.01 and ***p < 0.001 vs. Sham, ## p < 0.01 and ### p < 0.001 vs. MCAO+DMEM, + p < 0.05 and ++ p < 0.01 vs. CM1. CM, conditioned medium; DCX, Doublecortin; DMEM, Dulbecco's modified eagle's medium; MCAO, middle cerebral artery occlusion